
Description
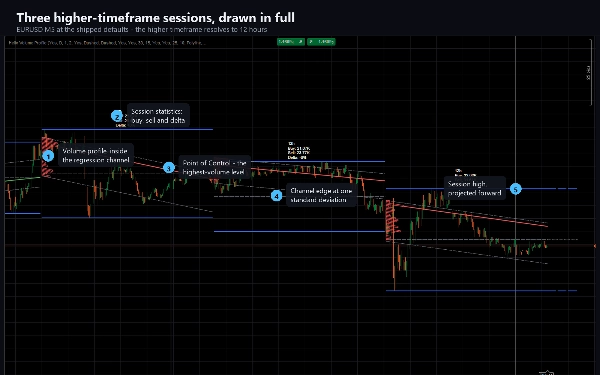
Helix Volume Profile construit une image complète de la session à plus long terme dans laquelle se trouve le graphique actuel.
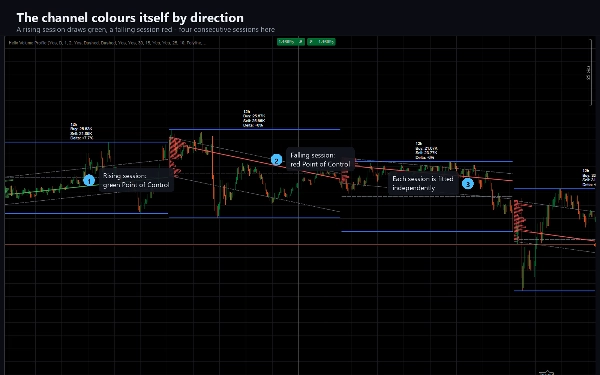
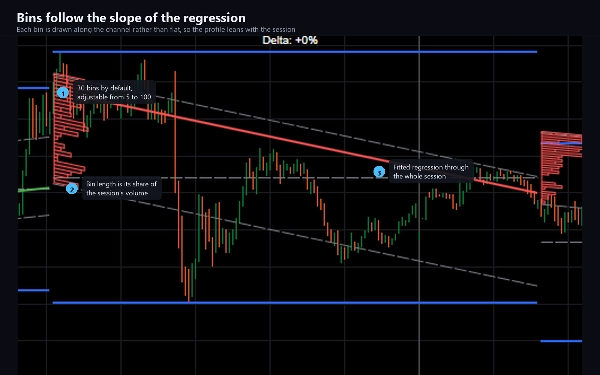
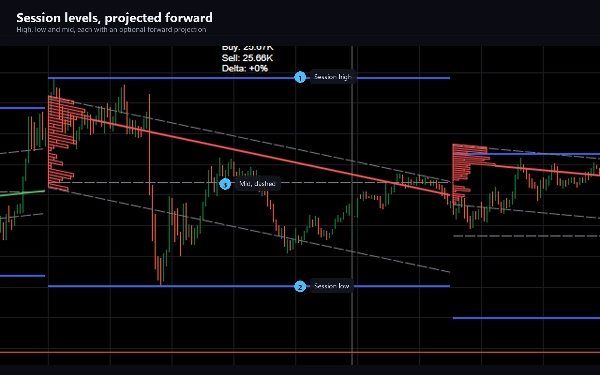
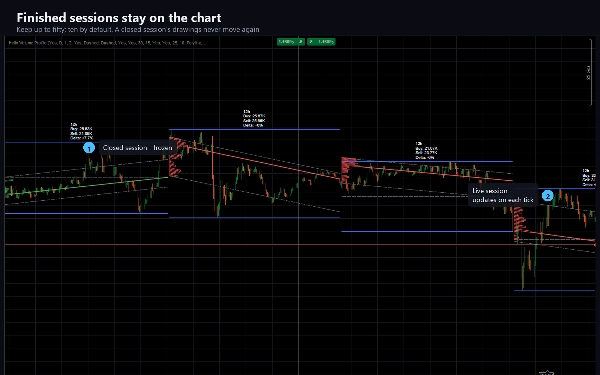
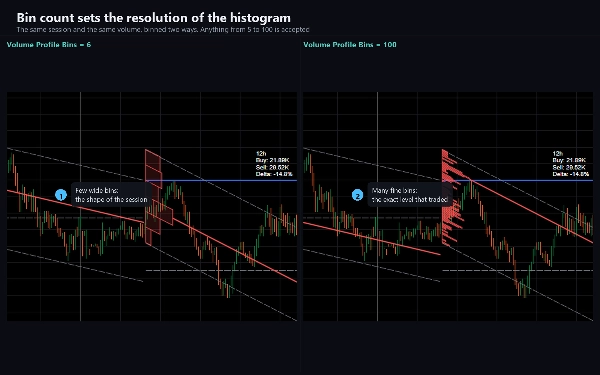
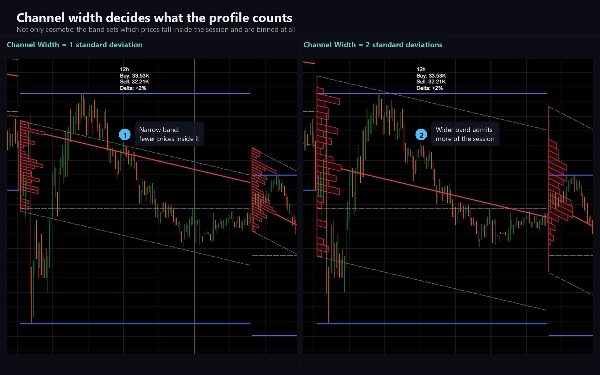
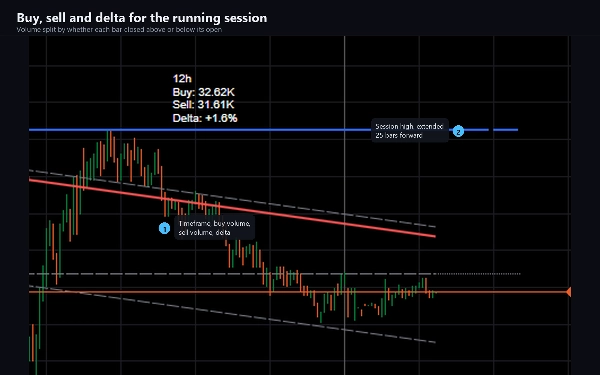
Pour chaque session, il ajuste une régression logarithmique sur chaque barre jusqu'à présent, trace un canal d'une largeur configurable en nombre d'écarts-types autour de celle-ci, et remplit ce canal avec un profil de volume dont les bacs suivent la pente de la régression plutôt que d'être plats. Le bac de volume le plus élevé est marqué par une ligne Point de Contrôle, colorée selon la direction du canal. Les niveaux haut, bas et médian de la session sont tracés à côté et peuvent être projetés vers l'avant, et une étiquette compacte indique le volume d'achat, le volume de vente et le delta entre eux.
Le timeframe supérieur est choisi par défaut pour vous et s'adapte au graphique : une session de 12 heures sur M5, quatre heures sur M1, deux jours sur M15, une semaine sur H1, un mois sur H4. Vous pouvez désactiver cela et définir la session vous-même - minutes, jours, semaines ou mois sont tous acceptés.
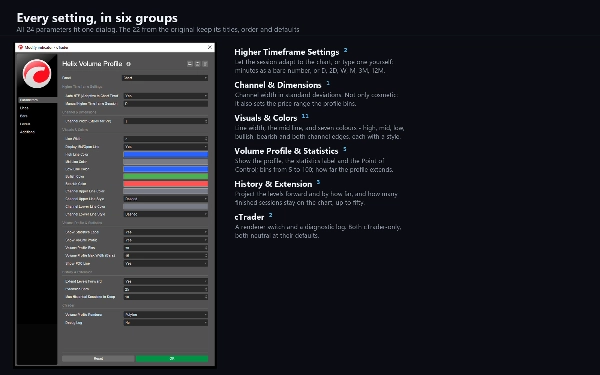
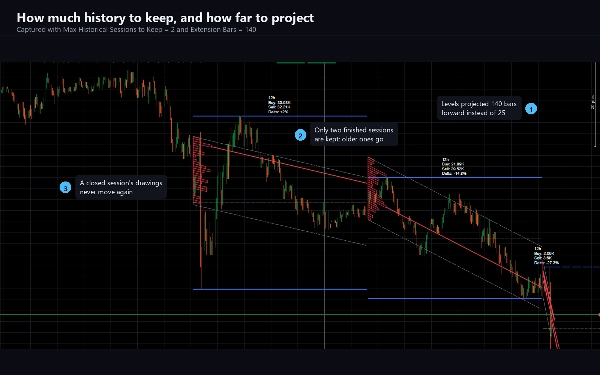
Tout est ajustable. La largeur du canal, le nombre de bacs du profil de 5 à 100, jusqu'où le profil s'étend, si le Point de Contrôle, l'étiquette des statistiques et les projections vers l'avant sont affichés, les largeurs et styles des lignes, sept couleurs, et combien de sessions terminées restent sur le graphique, jusqu'à cinquante.
À QUOI ÇA SERT
Lire où se situe le prix dans sa structure à plus long terme sans quitter votre timeframe de travail. Le canal montre la dérive et la dispersion de la session ; le profil montre où le volume s'est réellement accumulé à l'intérieur ; le Point de Contrôle marque le niveau qui a vu le plus d'activité. Les traders utilisent ces éléments pour encadrer les supports et résistances, juger si un mouvement est étiré par rapport à la session, et voir si l'achat ou la vente a dominé.
Convient à tout instrument et à tout timeframe. Il est le plus informatif sur les graphiques intrajournaliers de M1 à H4, où la session adaptative offre une fenêtre significative ; sur Daily et plus, définissez la session manuellement.
COMMENT IL SE COMPORT
La session en direct se met à jour à chaque tick et ses tracés bougent jusqu'à la fermeture de la session - le canal est réajusté, le profil reconstruit et les niveaux recalculés à chaque arrivée de barre. Une fois une session terminée, ses tracés sont figés et ne changent plus jamais. C'est délibéré et c'est ainsi que la méthode fonctionne ; si vous avez besoin de niveaux qui ne bougent jamais intrabar, lisez une session fermée plutôt que la session en direct.
Le volume sur un symbole forex est le nombre de ticks rapporté par votre courtier, donc le profil reflète votre propre flux.
TECHNIQUE
Indicateur, superposition. 24 paramètres. Aucune permission de trading, aucun accès aux fichiers et aucun accès réseau - il est construit avec AccessRights réglé sur None et ne peut pas passer d'ordre. Comprend une édition d'essai limitée à EURUSD sans limite de temps et sans fonctionnalités désactivées.
La documentation couvre l'installation, chaque paramètre avec son but, et un guide de dépannage qui explique chaque comportement qui surprend les utilisateurs.
Le trading comporte des risques. Les performances passées ne garantissent pas les résultats futurs.
Résumé
The higher timeframe session adapts automatically based on the chart timeframe (e.g., 12 hours on M5, one week on H1) but can be manually set to minutes, days, weeks, or months. Users can customize channel width, number of volume bins (5 to 100), profile extension, visibility of elements, colors, line styles, and how many past sessions remain visible (up to 50).
The live session updates on every tick, recalculating the channel and volume profile until session close, after which the data is fixed. Volume data reflects the broker's tick count for forex symbols. Helix Volume Profile is suitable for any instrument and timeframe, with particular utility on intraday charts from M1 to H4. It includes 24 adjustable parameters and operates without trading permissions or network access.
Discussion
Avis clients
5 | 0 % | |
4 | 100 % | |
3 | 0 % | |
2 | 0 % | |
1 | 0 % |