
Description
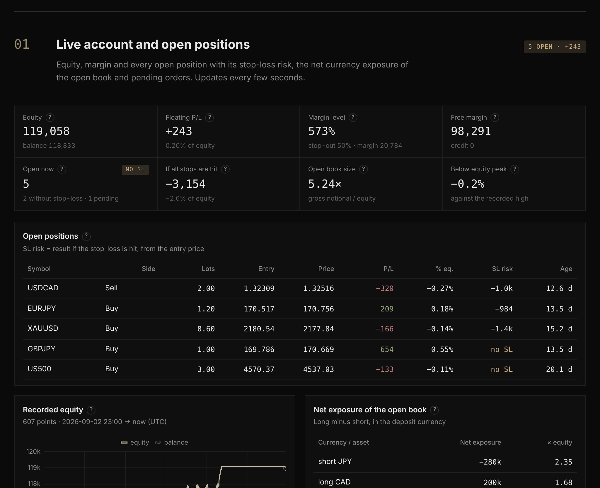
Quant Audit PRO audits a cTrader account from the whole account, not just its closed trades: closed deals, deposits and withdrawals, open positions with their stop-loss and take-profit, pending orders, live equity and margin, and the broker's own price history. With that it rebuilds the real equity curve, every bar marked to market, and measures risk where it actually happened: inside open positions, not only after they closed.
It opens as a Quant Audit PRO tab next to Positions, Orders and History. It can also open in a separate window. Everything updates live while cTrader runs.
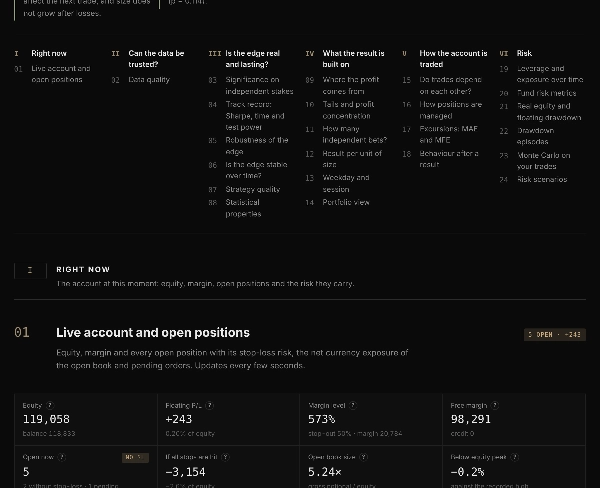
IS THE EDGE REAL AND LASTING?
- Significance on independent stakes: overlapping positions on one idea count as one bet. Uses bootstrap, Probabilistic and Deflated Sharpe, and minimum track record length.
- Robustness: confidence ranges, random halves, results without each instrument, label-shuffle tests.
- Stability (change-point test), strategy quality (SQN, Sterling, Burke, Pain, Kappa-3, Rachev, edge decay, years and quarters) and statistical properties (normality, volatility clustering, Hurst, variance ratios).
REAL EQUITY
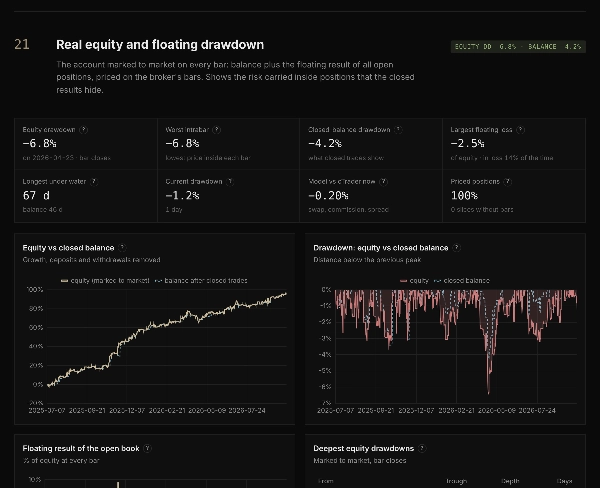
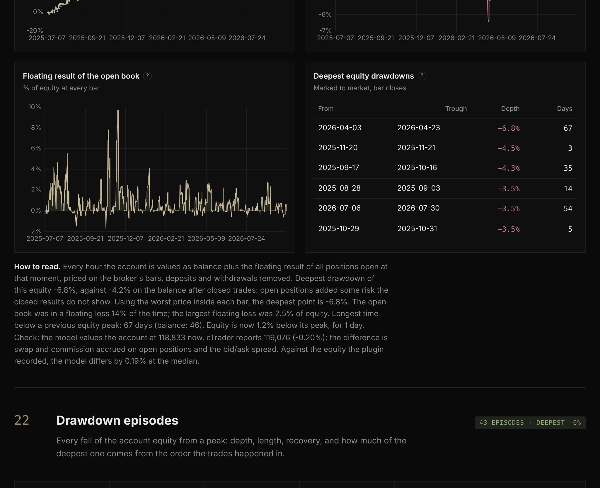
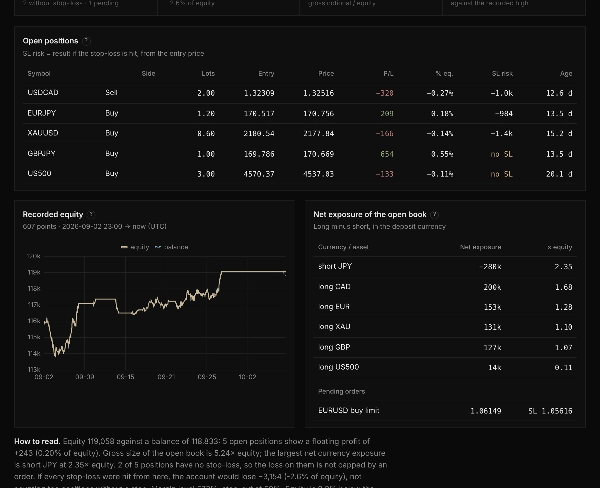
- Real equity and floating drawdown: the account valued every bar as balance plus all open positions on the broker's prices.
- Equity drawdown compared with the closed-balance drawdown, so you see the risk the closed results hide.
- Worst intrabar bound, floating result of the open book, time under water, deepest equity drawdowns.
- A live check against the equity cTrader reports.
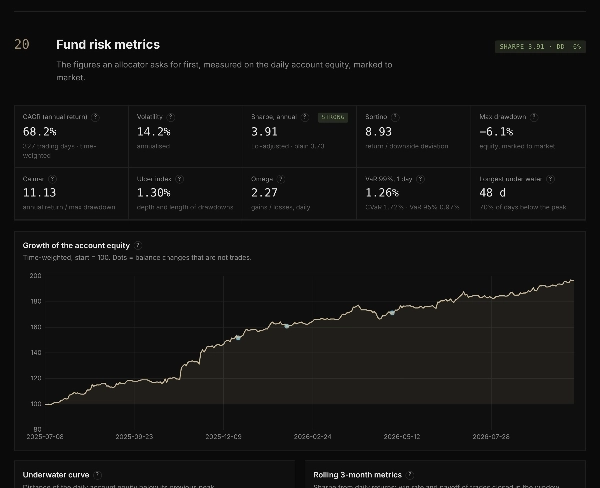
- Fund risk metrics on equity: annual return and volatility, Lo-adjusted Sharpe, Sortino, Calmar, Ulcer, Omega, VaR and CVaR, monthly calendar, rolling Sharpe. All are time-weighted, with deposits and withdrawals taken from cTrader's own transaction list.
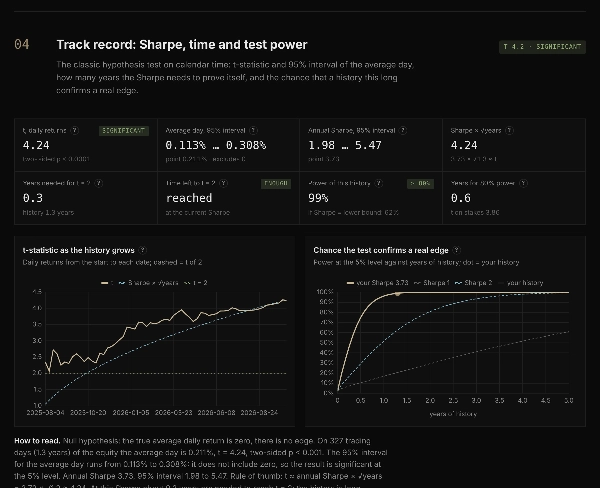
- Track record: t-statistic and 95% interval of the average day, annual Sharpe with its interval, years needed to reach t = 2, and the power of the test.
- Drawdown episodes and risk scenarios on real equity:
- every 3, 6 and 12-month period;
- three-year paths built from blocks of your real days;
- time to recover;
- the chance of a 20 / 30 / 50% drawdown within 1–3 years.
HOW THE ACCOUNT IS TRADED
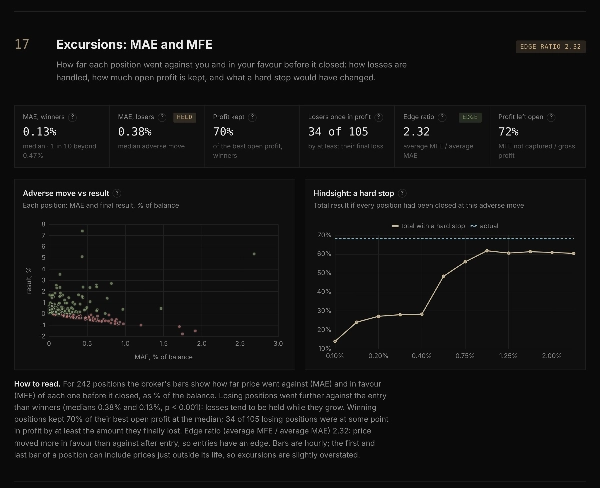
- Excursions (MAE / MFE) from the broker's bars:
- how far each position went against you and in your favour;
- whether losses are held while they grow;
- how much open profit is kept;
- losers that were once in profit;
- edge ratio;
- what a hard stop would have changed.
- Dependence between trades, position management (averaging into losses, adding to winners, partial closes) and behaviour after wins and losses.
WHAT THE RESULT IS BUILT ON
- Costs and swap: price movement, swap and commission, including swap accrued on open positions, and the break-even cost of the edge.
- Concentration: profit from the best trades, tail index.
- Result per unit of size, weekday and session, portfolio correlations.
- Monte Carlo on your trades: 5,000 years built only from your real results.
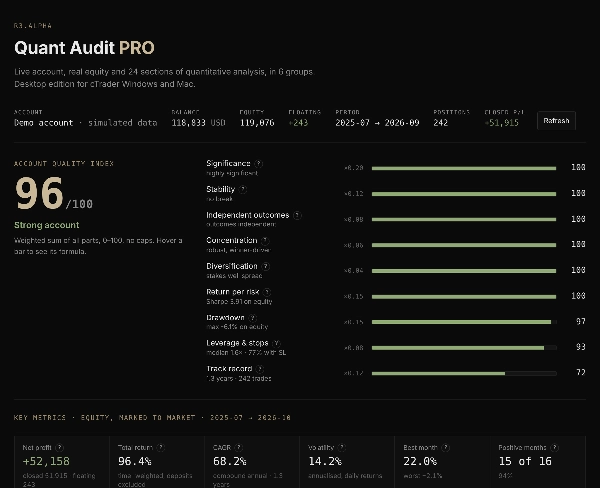
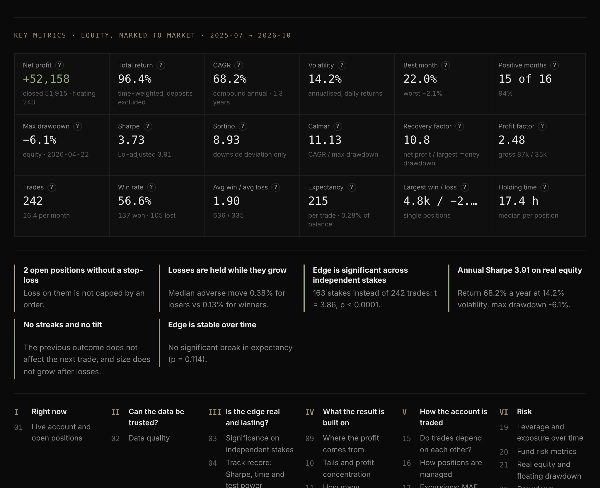
KEY METRICS at the top: net profit, total return, CAGR, volatility, best and worst month, positive months, max drawdown, Sharpe, Sortino, Calmar, recovery factor, profit factor, trades, win rate, average win / loss, expectancy, largest win / loss and holding time.
ACCOUNT QUALITY INDEX (0–100) at the top: a weighted sum of nine parts, with no single part capping the rest:
- significance 20%, stability 12%, independent outcomes 8%, concentration 6%, diversification 4%;
- return per unit of risk (Sharpe on equity) 15% and equity drawdown 15%;
- leverage and stop-loss protection 8%;
- length of the track record (years and trades) 12%.
Every bar shows its formula.
Every section ends with a plain-English verdict written from your own numbers, and every metric has a "?" explanation. The most important findings sit next to the index. Examples of findings: "Floating drawdown is deeper than closed results show", "3 open positions without a stop-loss", "Losses are held while they grow".
PRIVATE AND READ-ONLY. The plugin never places, modifies or closes orders. Your trading data is passed straight into the report on your computer and is never uploaded.
Résumé
The plugin operates as a dedicated tab or separate window within cTrader, updating live during platform operation. It evaluates the authenticity and durability of trading edge using statistical tests such as bootstrap, Probabilistic and Deflated Sharpe ratios, change-point tests, and robustness checks including random halves and label-shuffle tests.
Key features include real equity and floating drawdown metrics, detailed risk analysis with fund risk metrics (Sharpe, Sortino, Calmar, VaR, CVaR), track record statistics, and drawdown scenarios over multiple time horizons. It also analyzes trade excursions (MAE/MFE), position management behaviors, and the impact of costs and swaps.
An Account Quality Index (0–100) summarizes nine weighted components such as significance, stability, diversification, risk-adjusted returns, and track record length. Each metric is explained with formulas and plain-English verdicts based on the user’s data. The plugin is read-only and processes data locally without uploading.