
R3.Alpha Analytics
Multi-platform plugin
422 downloads
Version 1.0, Sep 2026
Windows, Mac, Mobile, Web
5.0
Reviews: 10

44.34M
Traded volume
45.33K
Pips won
422
Free installs
Description
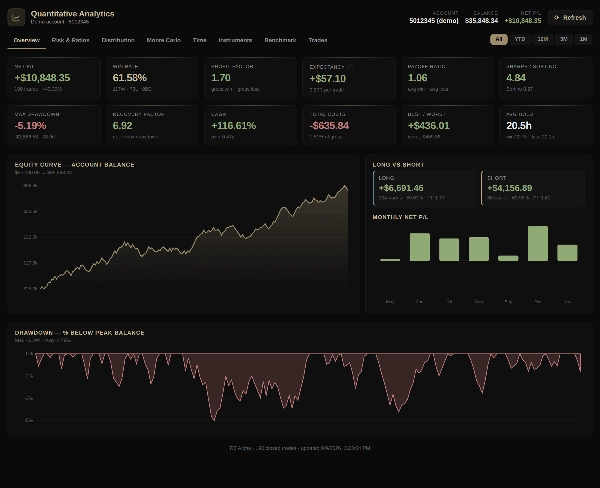
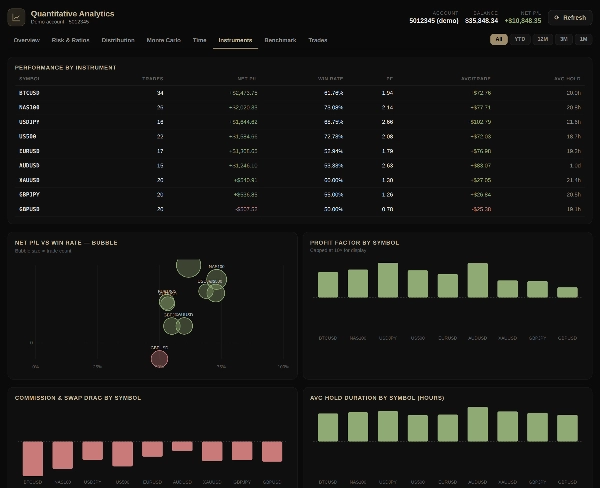
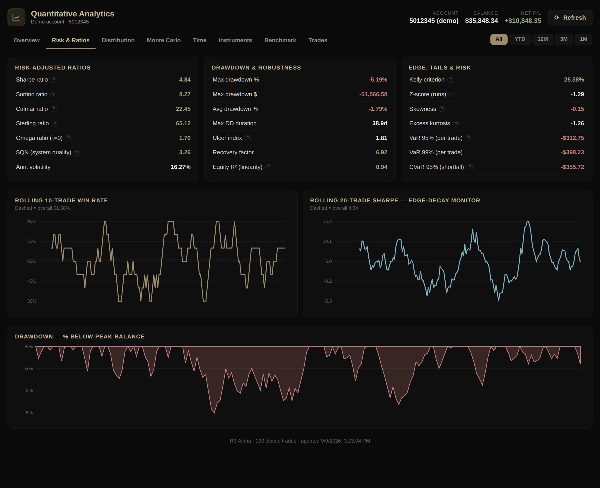
R3.Alpha Analytics turns your cTrader trading history into an institutional-grade performance and risk report — automatically, with no manual entry. It reads your closed trades and computes a full quantitative suite across ten tabs:
- Overview — net P/L, total return %, average monthly return, win rate, profit factor, expectancy, CAGR, max drawdown, equity curve and long vs short split.
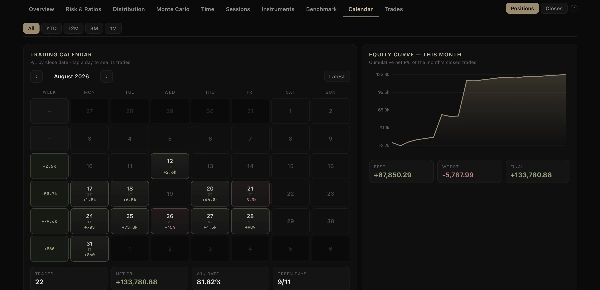
- Calendar — a daily P/L trading calendar with weekly totals, a tap-to-open day view and a full-year overview.
- Risk & Ratios — Sharpe, Sortino, Calmar, Sterling, Omega, SQN, VaR/CVaR, Ulcer index, recovery factor, rolling win rate and rolling Sharpe.
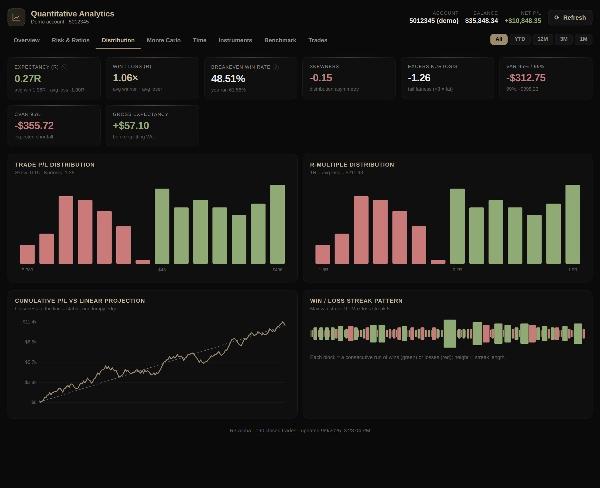
- Distribution — R-multiples, skewness, kurtosis, P/L histogram and win/loss streaks.
- Monte Carlo — risk of ruin, probability of profit, simulated drawdowns and equity percentiles.
- Time — performance by weekday, hour, month and holding time.
- Sessions — Asian, London, London–NY overlap and New York compared by strength and quality, with the best-performing pairs in each session.
- Instruments — results, profit factor, costs and holding time per symbol.
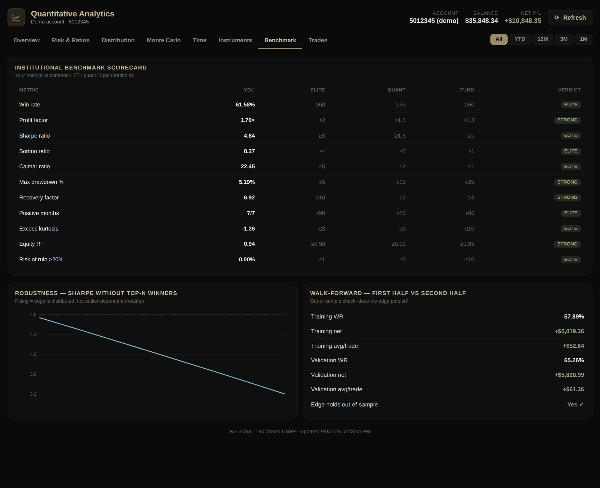
- Benchmark — a scorecard against HFT, quant and fund thresholds, with walk-forward validation.
- Trades — the complete trade log with entry and exit prices, holding time, swaps and commissions.
Every chart is interactive. Period filters (All, YTD, 12M, 3M, 1M) recompute every metric on calendar boundaries, and a Positions / Closes switch lets you count each position as one trade or match cTrader's own statistics, where every partial close is a separate trade. The plugin is strictly read-only and never places trades. Use it to audit your edge, monitor drawdown and consistency, and see exactly how your system performs.
Summary
AI summary
R3.Alpha Analytics is a web plugin designed for cTrader accounts that automatically generates institutional-grade performance and risk reports from your closed trade history. It provides a comprehensive quantitative analysis across eight interactive tabs, including:
1. Overview: net profit/loss, win rate, profit factor, expectancy, CAGR, and drawdown.
2. Risk & Ratios: metrics such as Sharpe, Sortino, Calmar, Sterling, Omega, SQN, VaR/CVaR, Ulcer index, and recovery factor.
3. Distribution: analysis of R-multiples, skewness, kurtosis, and profit/loss histograms.
4. Monte Carlo simulations: risk of ruin, probability of profit, and equity percentiles.
5. Time and instrument breakdowns.
6. Benchmark scorecard: compares performance against high-frequency trading, quantitative, and fund thresholds with walk-forward validation.
7. Full trade log.
All charts are interactive with period filters that dynamically update metrics. The plugin operates in read-only mode and does not place trades. It is intended for auditing trading edge, monitoring drawdowns and consistency, and detailed system performance evaluation.
1. Overview: net profit/loss, win rate, profit factor, expectancy, CAGR, and drawdown.
2. Risk & Ratios: metrics such as Sharpe, Sortino, Calmar, Sterling, Omega, SQN, VaR/CVaR, Ulcer index, and recovery factor.
3. Distribution: analysis of R-multiples, skewness, kurtosis, and profit/loss histograms.
4. Monte Carlo simulations: risk of ruin, probability of profit, and equity percentiles.
5. Time and instrument breakdowns.
6. Benchmark scorecard: compares performance against high-frequency trading, quantitative, and fund thresholds with walk-forward validation.
7. Full trade log.
All charts are interactive with period filters that dynamically update metrics. The plugin operates in read-only mode and does not place trades. It is intended for auditing trading edge, monitoring drawdowns and consistency, and detailed system performance evaluation.
Plugin profile
Plugin category
Analytics
Data access
Positions
History
Orders
Account
Customer reviews
5.0
Reviews: 10
5 | 100 % | |
4 | 0 % | |
3 | 0 % | |
2 | 0 % | |
1 | 0 % |
Customer reviews
September 30, 2026
September 30, 2026
I like that the statistics here don't just look like a bunch of numbers. This one can actually be used to analyze trading
September 28, 2026
September 28, 2026

September 25, 2026
I've used several similar tools I particularly liked the detailed trading history

September 25, 2026
After connecting, I immediately discovered several things in my trading that I hadn't noticed before, thank you

September 21, 2026
Discussion
FAQ
Risk/Reward
Risk/Reward
Trade Journal
Trade Statistics
Products available through cTrader Store, including trading bots, indicators and plugins, are provided by third-party developers and made available for informational and technical access purposes only. cTrader Store is not a broker and does not provide investment advice, personal recommendations or any guarantee of future performance.

















Price
44.34M
Traded volume
45.33K
Pips won
422
Free installs