Description
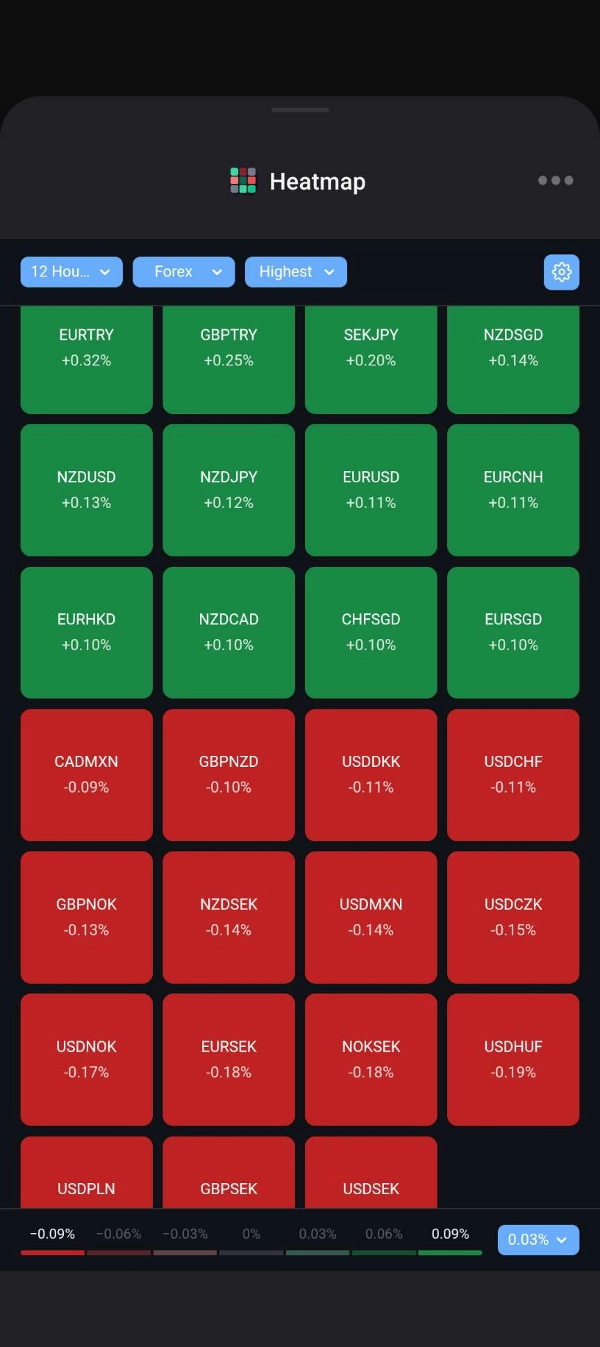
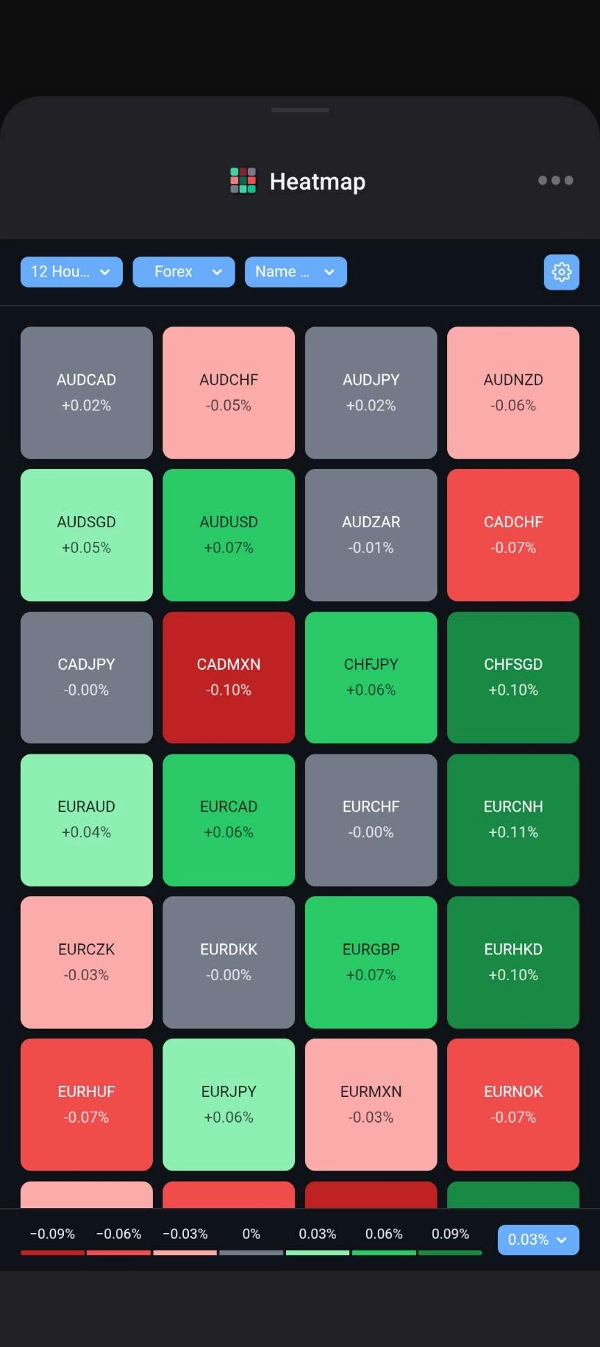
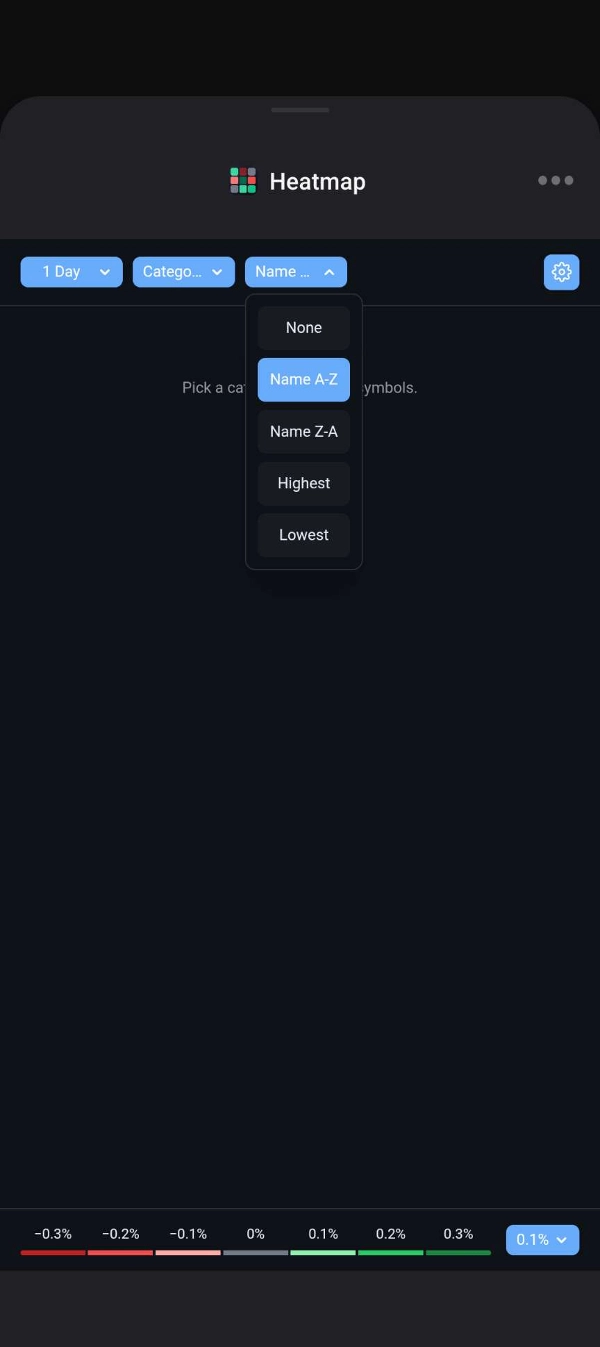
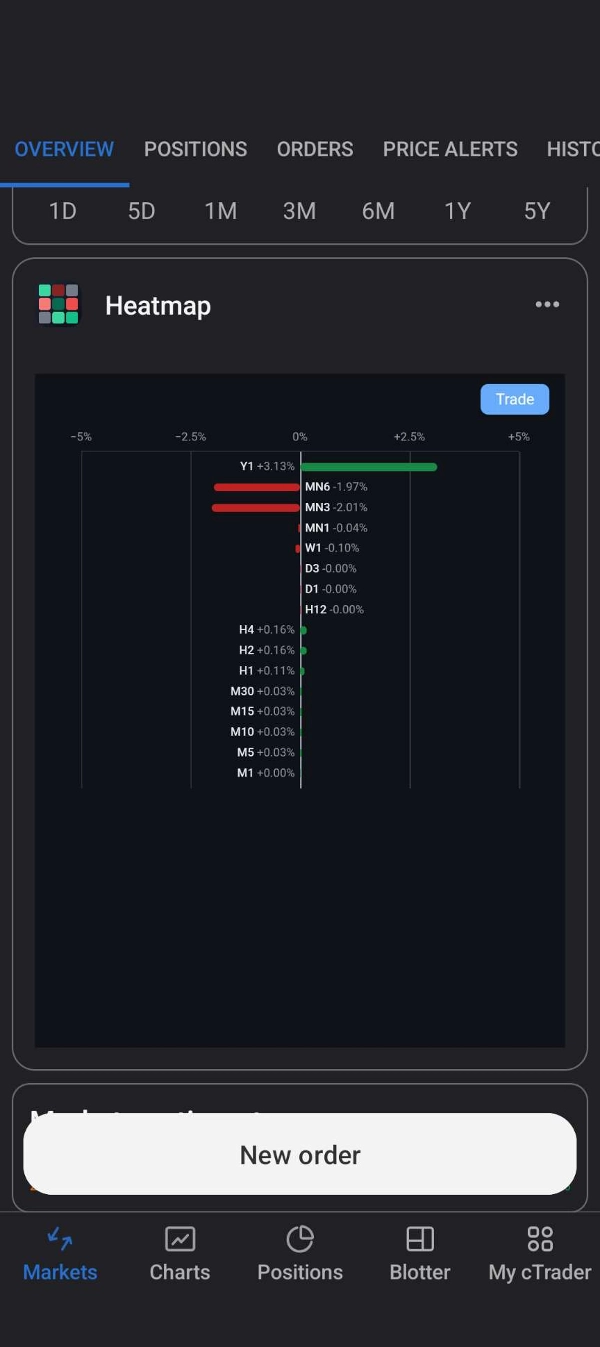
📊 Heatmap turns a category of symbols into a grid of tiles, each coloured by how far its price has moved over the timeframe you choose. Prices update live, so you can spot the strongest and weakest markets in seconds.
✨ KEY FEATURES
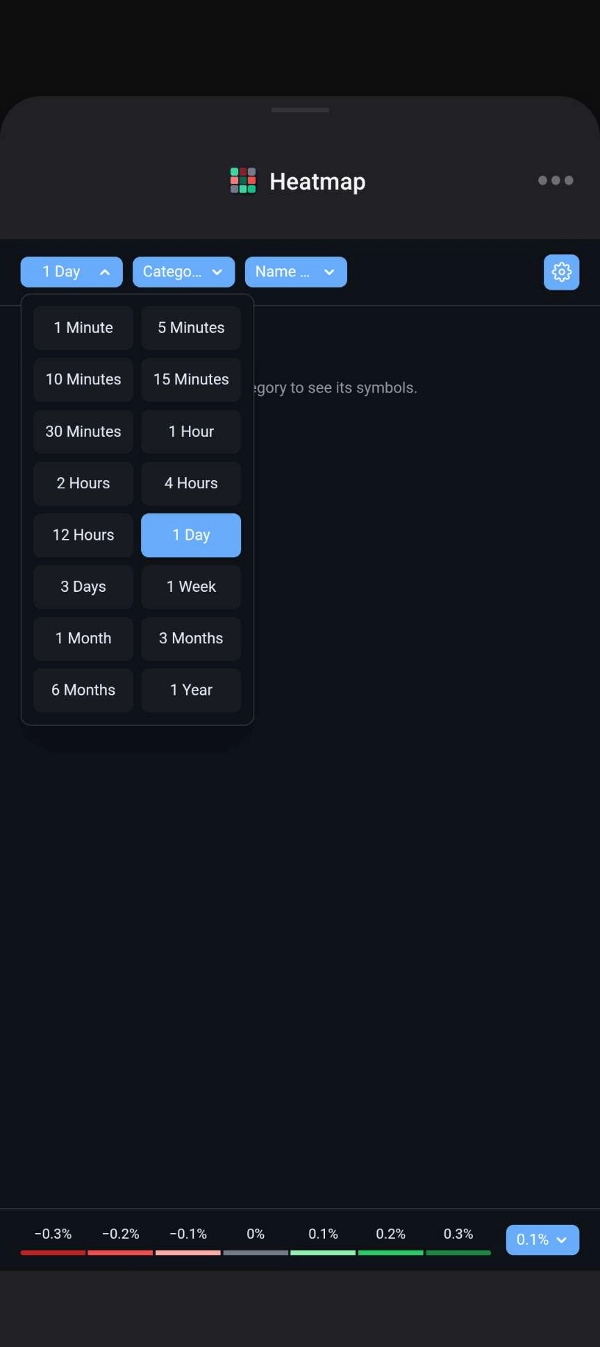
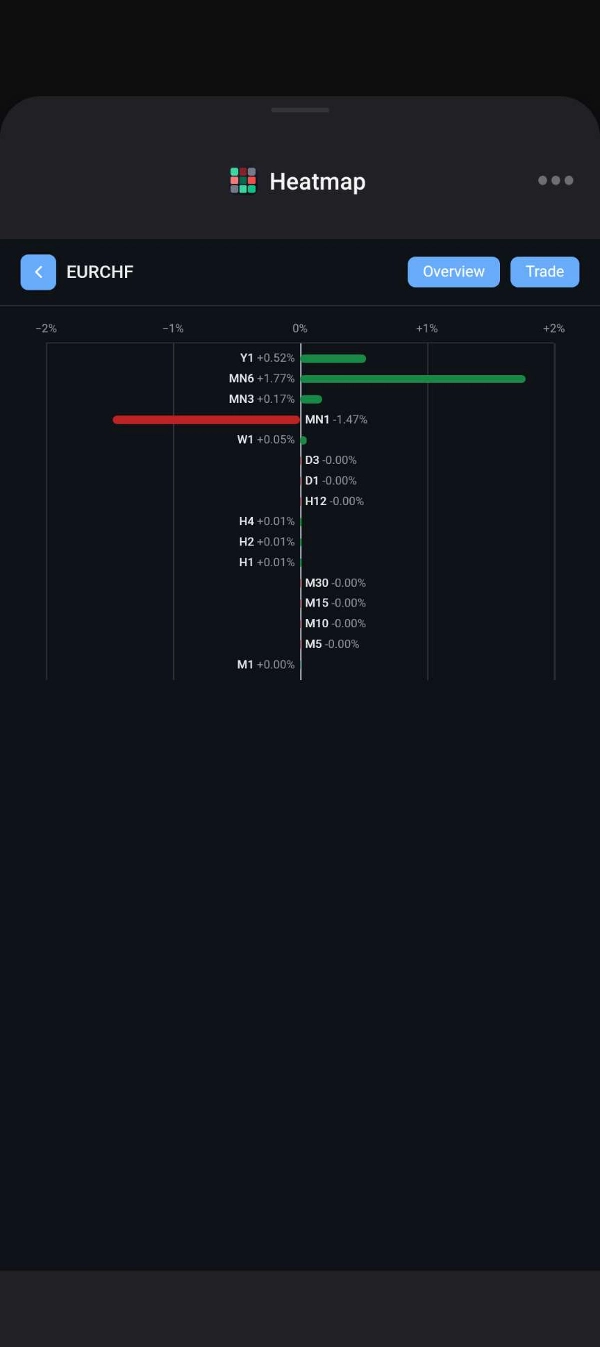
⏱️ 16 timeframes: 1, 5, 10, 15 and 30 minutes; 1, 2, 4 and 12 hours; 1 and 3 days; 1 week; 1, 3 and 6 months; 1 year.
⚡ Live updates: tiles move with every price tick and roll into each new bar as it opens.
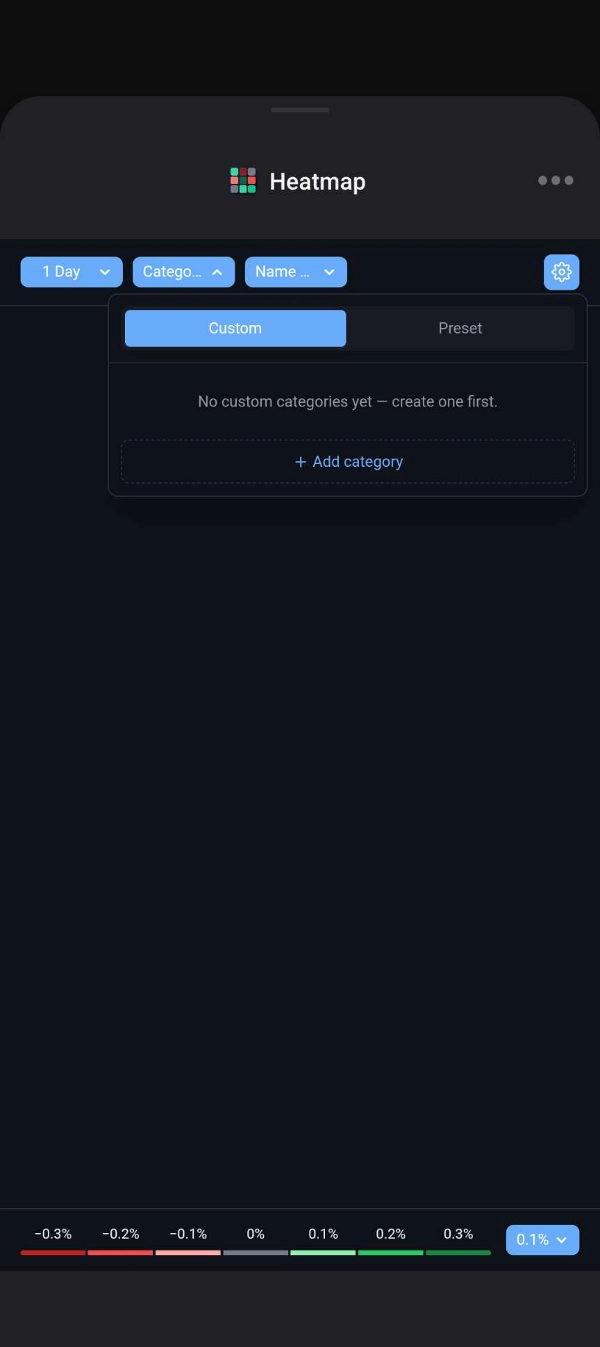
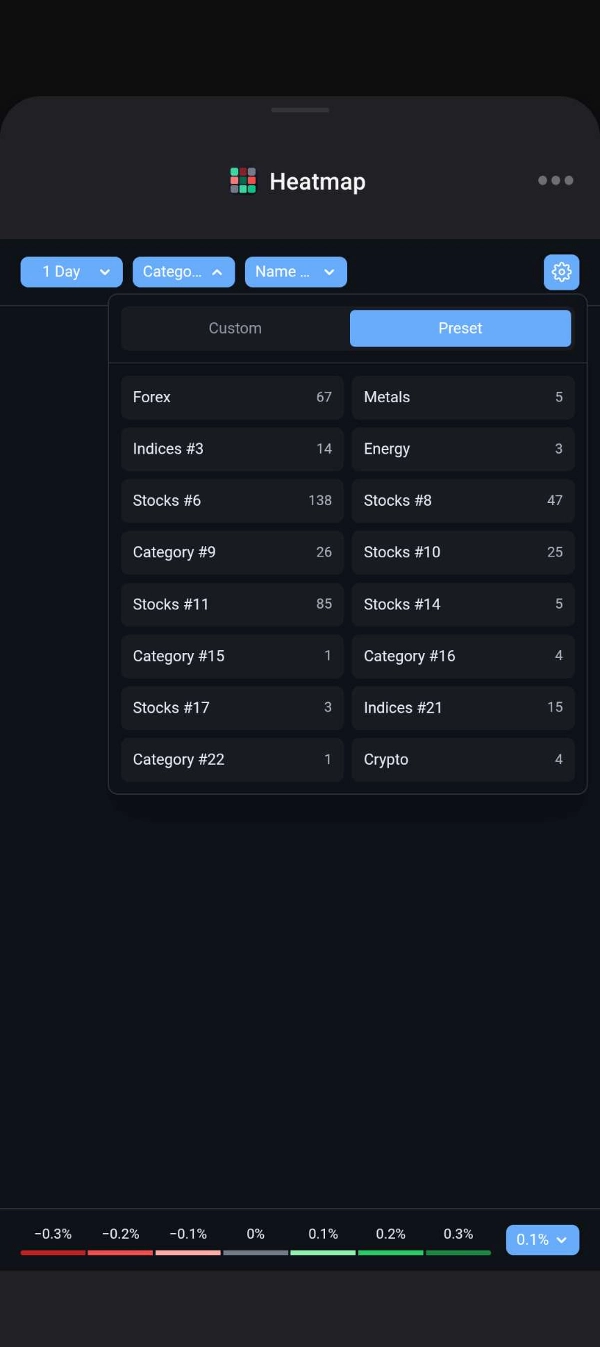
🗂️ Your broker's categories, named automatically (Forex, Indices, Metals, Energy, Crypto and more).
⭐ Custom categories: build your own lists, then rename them, delete them, or add and remove symbols with search.
↕️ Sorting: by name (A–Z or Z–A) or by change (highest or lowest first).
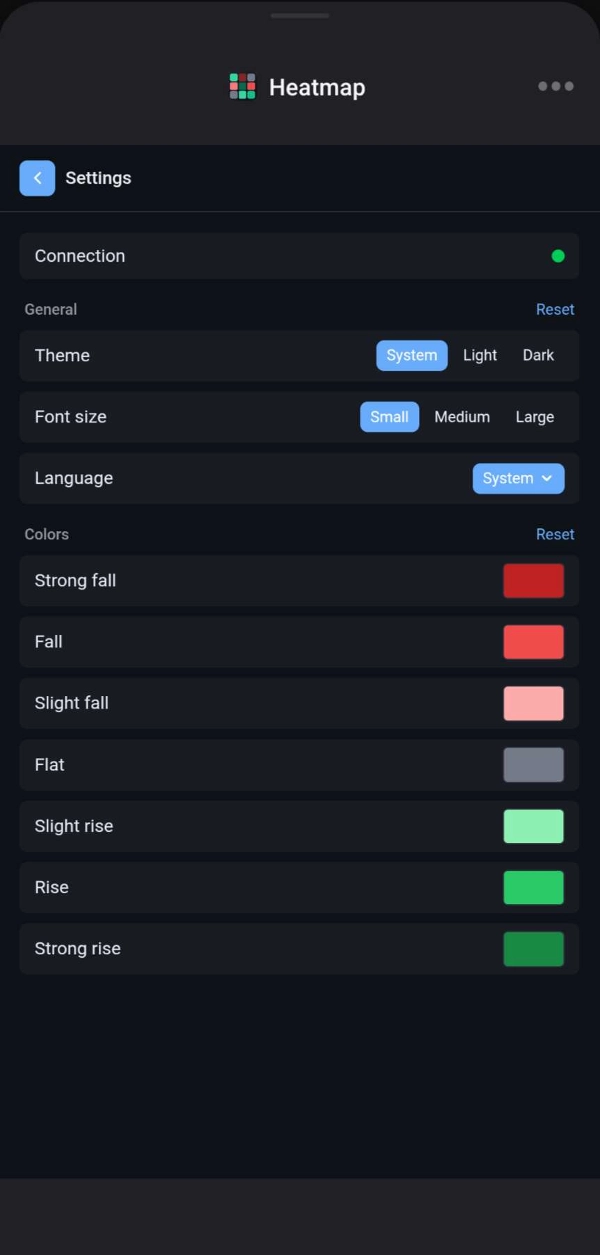
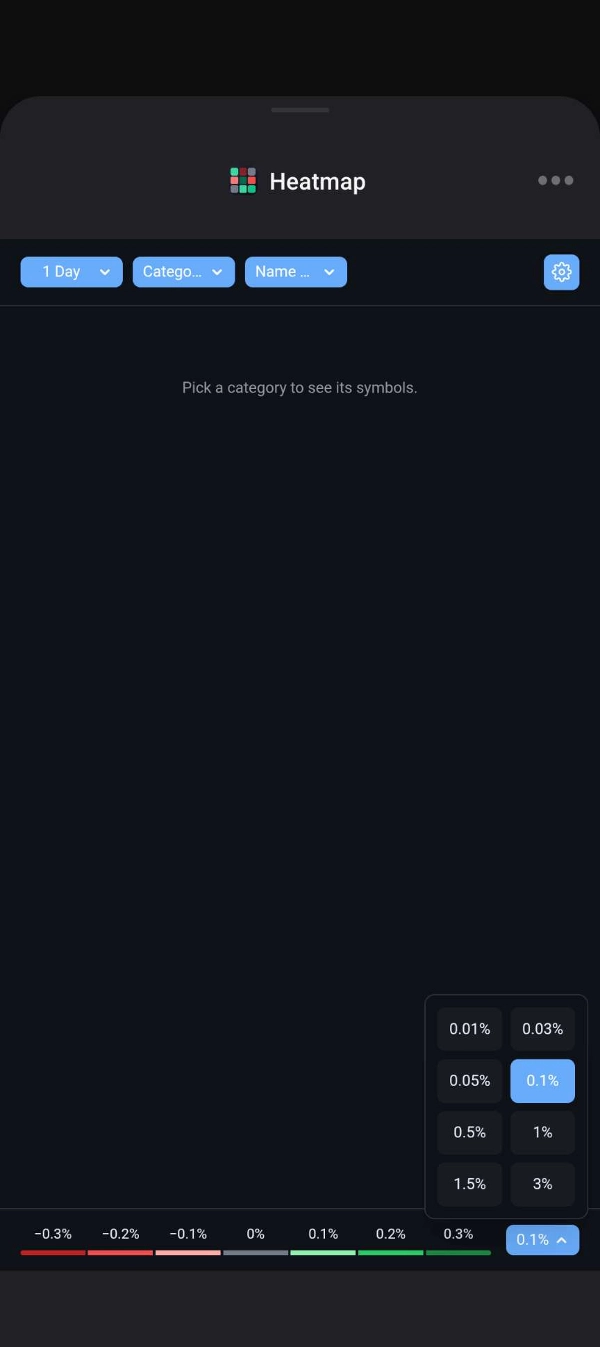
🎨 Adjustable colour scale: 7 colour bands from strong fall to strong rise. Set the step per band, tap the legend to hide a band, and pick your own colours.
🔍 Symbol page: tap a tile to see that symbol's move on all 16 timeframes in one chart. On mobile, jump straight to cTrader's overview or trade screen for it.
☁️ Cloud sync: your settings and custom categories follow you across devices. Theme, language, font size and colours follow you; timeframe, sorting, colour step, chosen category and custom categories are kept per trading account.
🌗 Your way: light, dark or system theme; three font sizes; English or Chinese.
📱 Works where you need it: on mobile in the symbol overview and trade tabs; on Web in the active symbol panel, Trade Watch or its own window.
✅ SUPPORTED PLATFORMS
🌐 cTrader Web
🤖 Android
🍎 iOS
🏷️ Category names are detected from the symbols they contain, so with some brokers a category may show as "Category #N".
Summary
Users can view symbols organized automatically by their broker’s categories (e.g., Forex, Indices, Metals, Energy, Crypto) or create and customize their own symbol lists with options to rename, add, or remove symbols. Sorting options allow arranging tiles alphabetically or by price change magnitude. The color scale is adjustable with seven bands representing different levels of price movement, customizable in color and step size.
Tapping a tile opens a detailed symbol page showing its price movement across all 16 timeframes in a single chart, with quick navigation to trading screens on mobile. Settings, custom categories, themes (light, dark, system), font sizes, and language (English, Chinese) synchronize across devices via cloud sync. The plugin integrates into various cTrader interface areas, including symbol overview, trade tabs, active symbol panel, and Trade Watch.
Discussion
Customer reviews
5 | 0 % | |
4 | 100 % | |
3 | 0 % | |
2 | 0 % | |
1 | 0 % |