
DynamicVolumeSupplyDemand
Indicateur
1.29K téléchargements
Version 1.0, Apr 2025
Windows, Mac
4.2
Avis : 5
Description
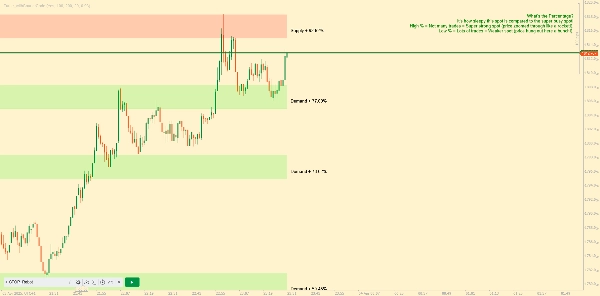
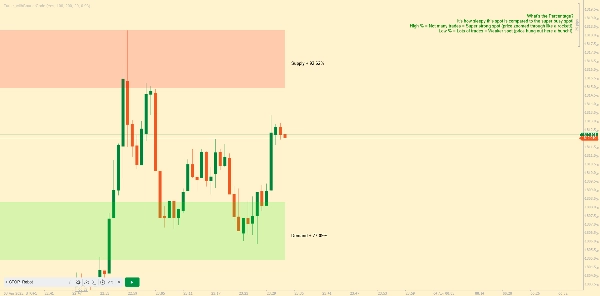
Présentation des zones dynamiques d'offre et de demande par AlgoAlpha recréées par moi pour la plateforme Ctrader. Cet indicateur est conçu pour identifier et visualiser automatiquement les zones dynamiques d'offre et de demande sur votre graphique, aidant les traders à repérer les zones potentielles de retournement et à évaluer le sentiment du marché avec une clarté accrue. Il s'adapte aux conditions du marché grâce à un mécanisme de rétroaction dynamique, le rendant plus réactif aux mouvements récents des prix. 📈💡
Caractéristiques principales
- 📊 Rétroaction dynamique : ajuste automatiquement la période de rétroaction en fonction du point pivot le plus récent, garantissant que les données les plus pertinentes sont analysées.
- 🎯 Détection des points pivots : utilise une période définie par l'utilisateur pour détecter les hauts et bas pivots significatifs, marquant avec précision les points potentiels de retournement.
- 🛠 Paramètres personnalisables : offre de nombreuses options de personnalisation, y compris la période de rétroaction, la sensibilité de détection des pivots, la résolution et la tolérance des zones.
- 🗺 Affichage visuel : affiche les zones d'offre et de demande sous forme de boîtes sur le graphique, avec une mise en surbrillance de fond pour différencier les zones haussières et baissières.
- 🖍 Zones codées par couleur : les zones sont codées par couleur pour une identification facile : vert pour haussier, rouge pour baissier et gris pour les niveaux neutres.
Résumé
Résumé IA
DynamicVolumeSupplyDemand is an indicator for the cTrader platform that automatically identifies and visualizes dynamic supply and demand zones on trading charts. It helps traders locate potential reversal areas and evaluate market sentiment by adapting to recent price movements through a dynamic look-back mechanism. Key features include:
- Dynamic Look-Back: Automatically adjusts the look-back period based on the latest pivot points to analyze the most relevant data.
- Pivot Point Detection: Uses a user-defined period to detect significant pivot highs and lows, marking potential reversal points.
- Customizable Parameters: Allows adjustment of look-back period, pivot detection sensitivity, resolution, and zone tolerance.
- Visual Display: Presents supply and demand zones as boxes on the chart with background highlighting to distinguish bullish and bearish zones.
- Color-Coded Zones: Zones are color-coded for clarity—green for bullish, red for bearish, and gray for neutral levels.
This indicator supports enhanced clarity in market analysis by dynamically adapting to changing market conditions and providing clear visual cues for supply and demand levels.
Profil de l'indicateur
Avis clients
4.2
Avis : 5
5 | 40 % | |
4 | 40 % | |
3 | 20 % | |
2 | 0 % | |
1 | 0 % |
Avis clients
October 12, 2025
Could you please make a new indicator so too remove the explanation and how the indicator works written on the chart? Very nice indicator otherwise!
August 12, 2025
Pros: Identifies dynamic supply and demand zones based on volume. Flexible settings, strong visual clarity. Cons: No alerts or tooltips. Lacks history of previous zones and user template saving.
May 15, 2025
This indicator finds the supply and demand areas very well but it has a problem. But the explanation and how the indicator works written on the chart is very annoying. I hope the designer of this software will solve this problem. Thank you
Discussion
Questions fréquentes
Les produits disponibles sur cTrader Store, notamment les bots de trading, les indicateurs et les plug-ins, sont fournis par des développeurs tiers et mis à disposition à titre informatif et à des fins d'accès technique uniquement. cTrader Store n'est pas un courtier et ne fournit aucun conseil en investissement, aucune recommandation personnelle ni aucune garantie quant aux performances futures.


Prix
Depuis le 09/01/2025
11.78K
Installations gratuites