present
Sign up and get $50 off your first purchase
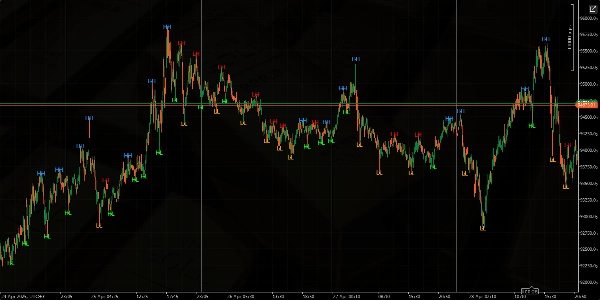
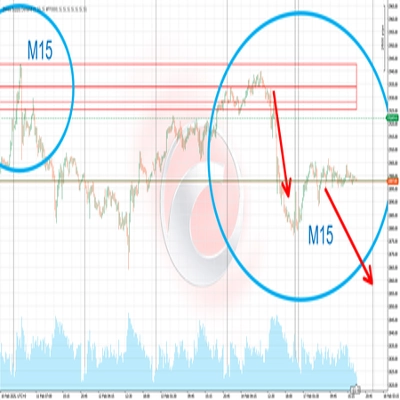
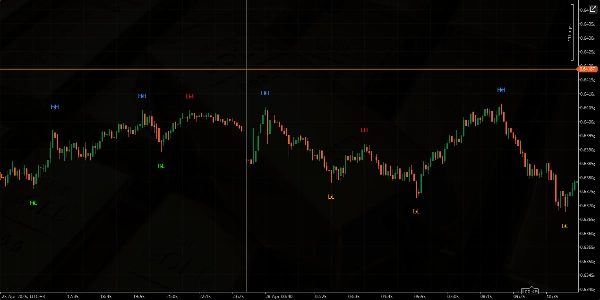
Trading product for Higher Highs Lower Lows Indicator, image 1
Higher Highs Lower Lows
Indicator
47 downloads
Version 1.0, Apr 2025
Windows, Mac
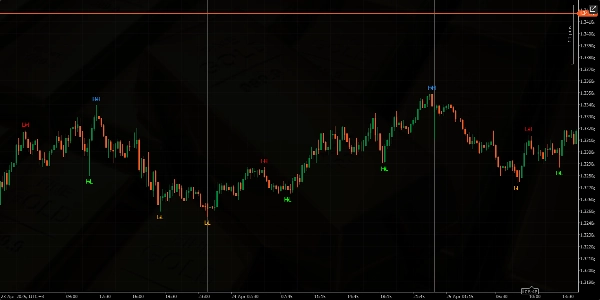
Trading product for Higher Highs Lower Lows Indicator, image 2
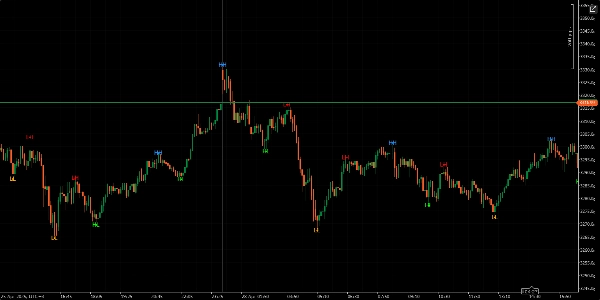
Trading product for Higher Highs Lower Lows Indicator, image 3
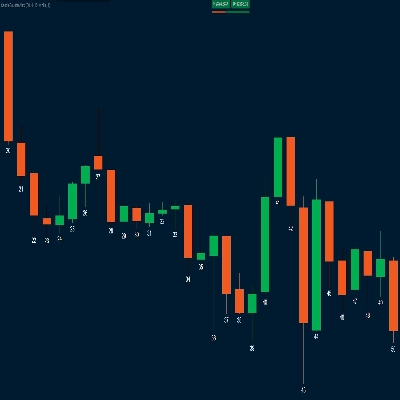
Trading product for Higher Highs Lower Lows Indicator, image 4
Trading product for Higher Highs Lower Lows Indicator, image 5
Since 16/03/2025
256
Free installs

Description

Summary

AI summary
Higher Highs Lower Lows is a technical indicator designed to automatically detect and mark key market structure points on trading charts. It identifies and highlights higher highs, lower highs, higher lows, and lower lows, which are fundamental elements in analyzing price trends and market momentum. This indicator assists traders by visually marking these critical price levels, facilitating the assessment of market direction and potential trend reversals. It can be applied across various markets and timeframes to support technical analysis. Installation of the indicator enables automatic market structure recognition without manual plotting.
Indicator profile

Customer reviews

0.0
Reviews: 0
Customer reviews
No reviews for this product yet. Already tried it? Be the first to tell others!

Discussion

FAQ

Products available through cTrader Store, including trading bots, indicators and plugins, are provided by third-party developers and made available for informational and technical access purposes only. cTrader Store is not a broker and does not provide investment advice, personal recommendations or any guarantee of future performance.

More from this author
Indicator
ATR
RSI
+8
The WaveTrend Indicator is a multifunctional oscillator designed to center the trend wave or movements in the trend.

You may also like

Indicator
BOS
MSS
+4
See confirmed BOS, CHOCH and SWEEP structure events on your cTrader chart.
Indicator
Volume
Key Levels
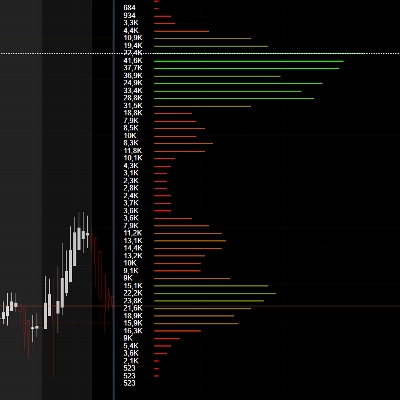
Free broker tick-volume profile context indicator with estimated POC, VAH/VAL, session/lookback modes, and clean visual
Indicator
ATR
RSI
+6
📊Zones Supply & Demand: Identifies key price levels with high volume concentration, marking Supply/Demand Zones & Marke
Indicator
RSI
RSI on the main chart with 45/55 momentum levels, overbought/oversold levels, averaged RSI, and multi-timeframe support.
Indicator
EMA
SMA
+3
MACD indicator modeled after TradingView, featuring a 4-color momentum histogram, sound/pop-up crossover alerts.
Indicator
BOS
Add standard-timeframe context candles to a native Renko chart.
Indicator
CandleCounterAlex – Candle Cycle Counter with Colors and Adjustable Position.
Indicator
ATR
MACD
+15
MACD Advanced -- It combines the standard MACD logic with a rich set of visual tools
Indicator
Forex
EURUSD
+3
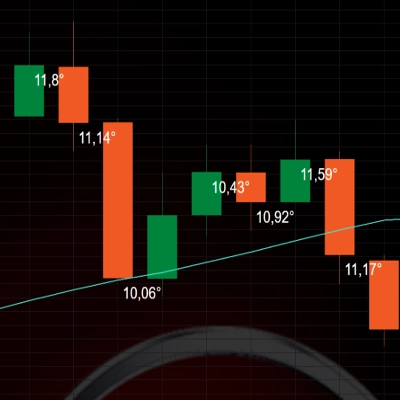
ATR-normalized MA slope in degrees, comparable across all instruments. Color-coded labels flag strong trend moves.
Indicator
ADX
ATR
+5
Ten confluence layers scored on every closed bar, with an anti-chop gate, pivot levels and a live dashboard.
Indicator
ATR
RSI
+4
RSI bands drawn on price, confluence-scored BUY/SELL signals, an ATR stop with three targets
Indicator
Forex
NAS100
+3
volumen perfile
Indicator
Forex
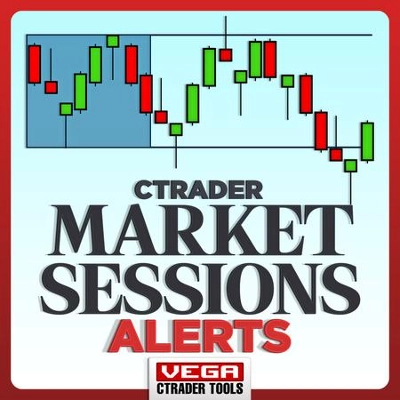
The cTrader Market Sessions Alerts Indicator marks global sessions, highlights key levels, and sends real-time alerts.
Indicator
AI
SMC
+19
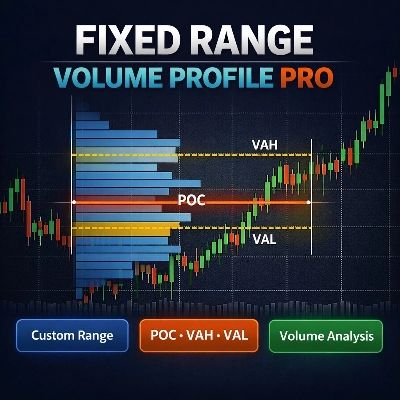
Fixed Range Volume Profile - TradingView Style (POC, VAH, VAL)
Indicator
Prop
Forex
+13
🎯Automatically detects and visualizes classical chart patterns using multi-timeframe swing point analysis.
Indicator
ATR
RSI
+7
Identify bullish and bearish Order Blocks to spot key support/resistance levels and potential trend reversals! 📈🔄
Indicator
Signal
Fractal Arrow Buy and Sell Indicator
Indicator
Signal
Scalping
Average accuracy of around 60% to 70% on 45min timeframes it is highly recommended to use stop losses

Price

Since 16/03/2025
256
Free installs