
Descrição
MarketSessions – Sua Vantagem de Negociação, Visualizada
Transforme o Tempo do Mercado em Poder de Negociação
MarketSessions é um indicador profissional para cTrader que traz as sessões globais do mercado à vida — para que você possa negociar onde o momentum é real e o timing se torna sua vantagem.
🚀 Por que os Traders Confiam no MarketSessions
Veja o Ritmo do Mercado
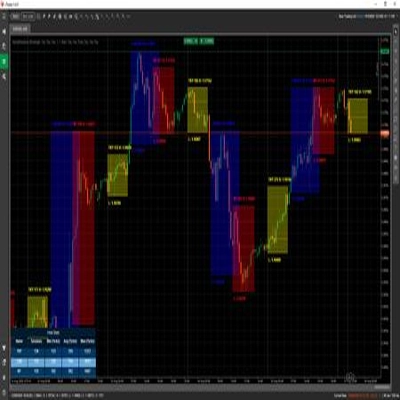
Visualize instantaneamente Londres, Nova York, Tóquio, Sydney – e qualquer outra sessão que desejar – com sobreposições limpas e elegantes que se adaptam ao seu gráfico.
Negocie de Forma Mais Inteligente, Não Depois
Receba notificações em tempo real quando as sessões abrirem, fecharem ou atingirem níveis-chave – entregues via Telegram ou Discord (sua escolha).
Ataque Zonas de Alta Probabilidade
Aproveite ferramentas integradas como o Opening Range Breakout, Point of Control (POC) e linhas de sessão de precisão para que você nunca perca um rompimento ou rejeição.
🎯 Principais Recursos
- Visualização e Gerenciamento de Sessões – horários, cores e etiquetas totalmente personalizáveis, mesmo para mercados sobrepostos
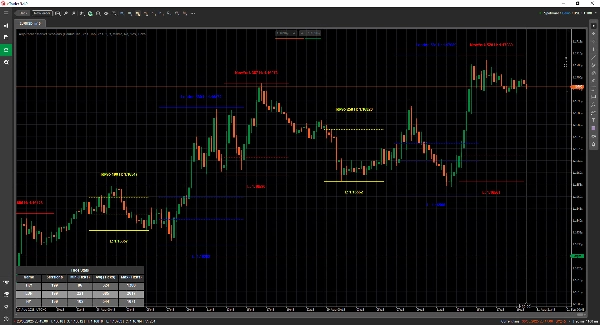
- Ferramentas Avançadas de Desenho – inclui desenhadores de Linha Dupla ❘❘ e Linha do Meio, retângulos de rompimento, marcadores de texto e um Modo de Linha Dupla para traders minimalistas
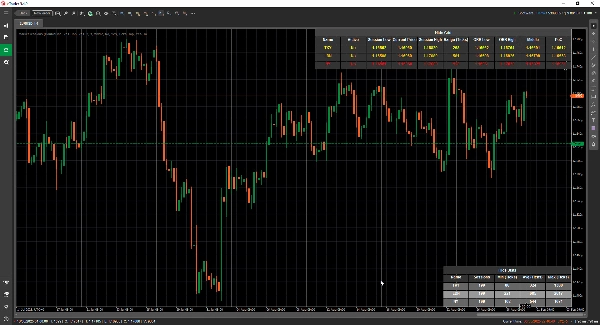
- Painel de Estatísticas – veja o Total de Sessões, Min, Média e Máx para cada sessão (em Ticks, Pips ou %)
- Modo Grade - permite visualizar as sessões ativas atuais em uma tabela, para que você possa ver as sessões em um timeframe maior.
- Configuração Flexível – personalize a posição do texto, modos de alcance, preferências de desenho e temas
- Alertas e Integrações – integração com Telegram/Discord com alertas sonoros e visuais
📦 O Que Você Recebe
- MarketSessions.algo (pronto para usar)
- Atualizações Vitalícias (sem taxas recorrentes)
- Suporte Amigável (acesso direto se precisar de ajuda)
💻 Requisitos
- plataforma cTrader
- runtime .NET 6.0
✅ Instale em minutos
✅ Negocie com absoluta confiança
📘 Referência de Parâmetros (Versão Amigável)
Lista de Sessões Disponíveis
- Nova York
- Londres
- Frankfurt
- Tóquio
- Hong Kong
- Xangai
- Singapura
- Wellington
- Sydney
- Toronto
Configurações Gerais
- Modo de Desenho – Escolha como as linhas da sessão são desenhadas no gráfico (Retângulo / Linha Dupla / Linha do Meio)
- Mostrar Nome da Sessão – Exiba o nome de cada sessão diretamente no seu gráfico
- Localização do Nome da Sessão – Decida onde o texto do nome da sessão aparece (topo, centro, inferior)
- Texto em Negrito – Deixa o nome da sessão em negrito para facilitar a leitura
- Deslocamento do Texto Superior – Adiciona espaçamento extra a partir do topo (para que o texto não sobreponha as velas)
- Deslocamento do Texto Inferior – Adiciona espaçamento extra a partir da parte inferior da área da sessão
- Localização do Tempo do Texto – Mostra o horário da sessão junto com o nome da sessão
- Usar Nome Curto da Sessão – Alterna para nomes mais curtos (ex: NY em vez de Nova York)
- Mostrar Alcance da Sessão – Destaca toda a faixa de preço coberta pela sessão
- Modo de Alcance da Sessão – Escolha como o alcance de preço é calculado (máximo/mínimo ou abertura/fechamento)
- Localização do Alcance da Sessão – Coloque o marcador de alcance no topo ou na parte inferior do alcance
- Mostrar Máximo – Exibe o preço mais alto da sessão
- Localização do Máximo – Escolha onde o rótulo Máximo aparece
- Mostrar Mínimo – Exibe o preço mais baixo da sessão
- Localização do Mínimo – Escolha onde o rótulo Mínimo aparece
- Estender Linhas de Máximo/Mínimo (Minutos) - Permite estender essas linhas por x minutos à frente
- Mostrar Breakout da Faixa de Abertura – Desenha uma caixa de breakout na abertura da sessão
- Estender Linhas ORB (Minutos) - Permite estender essas linhas por x minutos à frente
- Mostrar Linhas do Meio – Adiciona linhas médias para ajudar a identificar o valor justo
- Estender Linhas do Meio (Minutos) - Permite estender essa linha por x minutos à frente
- Mostrar PoC – Exibe o Point of Control (preço mais negociado da sessão)
- Estender Linhas do Meio (Minutos) - Permite estender essa linha por x minutos à frente
- Transparência do Preenchimento – Controla quão transparente é o preenchimento de fundo da sessão
Estatísticas
- Desenhar Estatísticas – Mostrar/ocultar o painel de estatísticas no seu gráfico
- Alinhamento Horizontal das Estatísticas – Alinhar o painel (Esquerda / Centro / Direita)
- Alinhamento Vertical das Estatísticas – Escolha se o painel aparece no topo ou na parte inferior
- Cor do Título – Cor do texto para o título “Estatísticas”
- Cor das Linhas Pares – Cor de fundo para linhas de número par no painel
- Cor das Linhas Ímpares – Cor de fundo para linhas de número ímpar no painel
- Cor do Primeiro Plano – Cor do texto usada dentro do painel
Telegram
- Usar – Ativar ou desativar alertas do Telegram
- Token – Seu token do Bot do Telegram
- ChatId – O ID do chat onde os alertas serão enviados
Discord
- Usar – Ativar ou desativar alertas do Discord
- WebhookUrl – URL do webhook do Discord para envio de alertas de sessão
Alertas Sonoros
- Alerta Sonoro de Nova Sessão – Toca um som quando uma nova sessão começa
- Alerta Sonoro de Sessão Concluída – Toca um som quando uma sessão termina
Grade
- Forçar Grade - Força a renderização da grade independentemente do TimeFrame usado
- Grade Visível para TimeFrame Superior - Permite selecionar em qual TimeFrame e além dele esta Grade é visível
- Notificação em Caixa de Mensagem - Notifica o motivo pelo qual o modo de renderização normal não é possível e muda para o Modo Grade
- Alinhamento Horizontal da Grade
- Alinhamento Vertical da Grade
Exemplo de Sessão (Nova York)
⚠️ Os mesmos parâmetros se aplicam a cada sessão (Londres, Tóquio, Sydney, etc.)
- Ativo – Ative ou desative esta sessão específica
- Cor – Cor da sessão usada no gráfico
- Preencher Região – Preenche o fundo da área da sessão
- Estilo da Linha – Escolha o estilo da linha (sólida, tracejada, etc.)
- Espessura da Linha – Controle a espessura das bordas da sessão
Faça do relógio do mercado seu aliado
Adquira o MarketSessions hoje e nunca mais perca uma sessão lucrativa.


![Logótipo de "[CB] Pivot Points Pro"](https://cdn.ctrader.com/image/webp/43463c82-67b0-4f10-a4ba-901bba091d81_32594)


![Logótipo de "High-Low Divergence [Iridio Capital]"](https://cdn.ctrader.com/image/webp/443c4661-7abb-40f1-842f-4b6ec560649b_40914)


