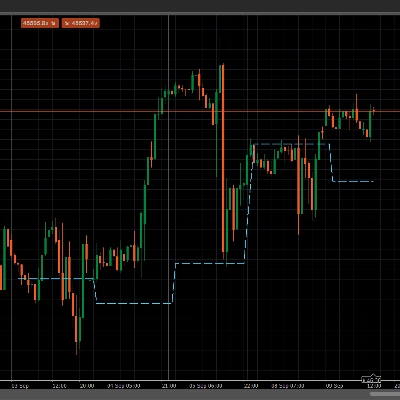
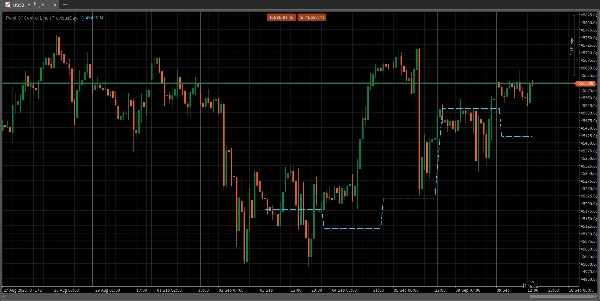
Logo "POC session line_noSourceCode"
POC session line_noSourceCode
Gambar unggahan "POC session line_noSourceCode"
Sejak 21/04/2025

The Point of Control (POC) is a price level on a volume profile chart where the most trading volume has been conducted within a specified period. This level acts as a significant support or resistance zone because it represents a price where large trading institutions were most active and where market price found consensus. Traders use the POC to identify key price zones, gauge market sentiment, and anticipate potential price movements and reversals

Indicator profile
0.0
Ulasan: 0
Ulasan pelanggan
Belum ada ulasan untuk produk ini. Sudah mencobanya? Jadilah pemberi ulasan pertama!
Forex
Indices
Products available through cTrader Store, including trading bots, indicators and plugins, are provided by third-party developers and made available for informational and technical access purposes only. cTrader Store is not a broker and does not provide investment advice, personal recommendations or any guarantee of future performance.

Produk lain dari penulis ini

Displays the POC line for previous sessions in an easy to see manner.

Anda mungkin juga suka

Logo "IR Macd + MacdLine"
5.0
(2)
Gratis
some user add moving average to macd to see better. in ctrader 4.3.11 there is a problem with this . I make a macd tha
Want a cBot based on this indicator? Contact us!
EMA MTF TREND PRO - Multi-timeframe trend analysis overlay indicator, 6 timeframes - in one table with ADX
Pressure Scanner is a volatility-and-momentum to show both pressure states (squeeze on/off) and directional
CISD Projections with MTF panel: detects market shifts, auto targets, and clear real-time buy/sell signals.
Statistically-grounded trend channels via linear regression — clear trend & reversal zones.
uses HTF 1hr,4hr, 1D to check for valid directions enjoy
Detect institutional breakout zones with smart volume & channel analysis — by PrimeQuant.
ADXR, KDJ, SineWave, Bollinger Band Volatility and AEOscillator.
Volume Profile Supply Demand
BWMFI_1
PrimeTrend: ATR trendline detects reversals, plots entry/SL/3 targets. Tune params (speed vs. robustness). Backtest +
The CRT indicator helps ICT traders identify candlestick patterns, enhancing analysis of higher timeframe on lower
🚀 Automated Elliott Wave & Fibonacci tool for cTrader. Spot trends, corrections & retracements fast.
Institutional FVG detection with HTF projection, precise volume deltas, and smart fill logic.
EMA Clouds, Multi-Timeframe (MTF) Overlay, Swing High/Low detection, and a smart Dashboard with neutral zone filtering.
Fractal MSS with 4H Bias is a smart market-structure indicator designed to detect: Market Structure Shifts (MSS)
Premium FTMO-ready dashboard. Spots exact reversals, filters fakeouts, and gives precise Price Action entry levels.
Sejak 21/04/2025