
ATR on Chart
Indikator
250 unduhan
Versi 1.0, Sep 2025
Windows, Mac
Deskripsi
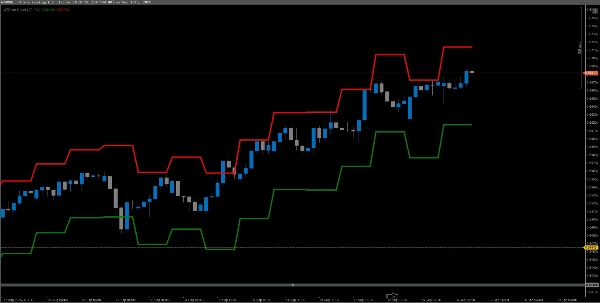
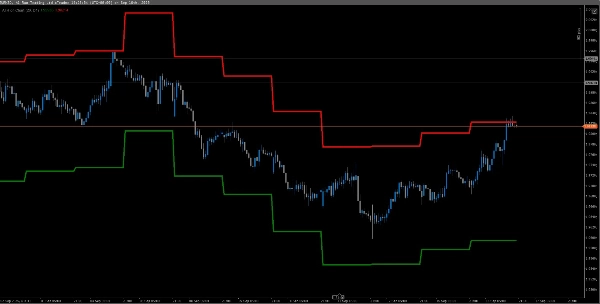
Menampilkan rata-rata rentang sebenarnya. Menampilkan ATR pada grafik untuk visualisasi yang mudah, kerangka waktu default adalah Harian tetapi Anda dapat mengubahnya.
Ringkasan
Profil indikator
Ulasan pelanggan
0.0
Ulasan: 0
Ulasan pelanggan
Belum ada ulasan untuk produk ini. Sudah mencobanya? Jadilah pemberi ulasan pertama!
Diskusi
Pertanyaan umum
BTCUSD
Forex
Signal
Indices
EURUSD
Commodities
GBPUSD
Crypto
XAUUSD
ATR
USDJPY
Produk-produk yang tersedia melalui cTrader Store, termasuk bot trading, indikator, dan plugin, disediakan oleh pengembang pihak ketiga serta hanya ditujukan untuk akses teknis dan informasi. cTrader Store bukan broker dan tidak menyediakan saran investasi, rekomendasi pribadi, atau jaminan apa pun tentang kinerja di masa mendatang.


Harga
Sejak 11/09/2025
250
Instal gratis