
Deskripsi
Taiz Pro Volume Profile: Alat Analisis Ultimate untuk Mengungkap Niat Pasar
Apakah Anda bosan mengandalkan indikator terlambat yang tidak memberikan gambaran lengkap? Indikator Taiz Pro Volume Profile bukan hanya alat lain, melainkan jendela Anda untuk melihat apa yang terjadi "di balik layar" di pasar.
Berbeda dengan indikator volume tradisional yang menunjukkan "kapan" perdagangan terjadi, indikator ini mengungkap "di mana" perdagangan terjadi, memberikan Anda keunggulan kompetitif yang nyata.
---
· Apa yang ditawarkan indikator ini untuk Anda?
o 📈 Menentukan area likuiditas tinggi: Temukan level harga di mana volume perdagangan terbesar terkonsentrasi. Ini adalah area yang dipertahankan oleh pembuat pasar dan institusi besar.
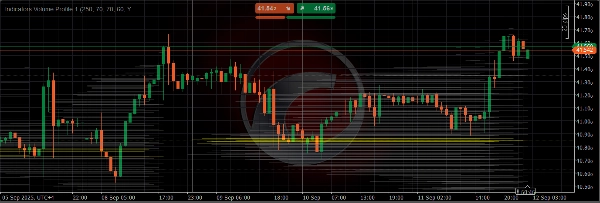
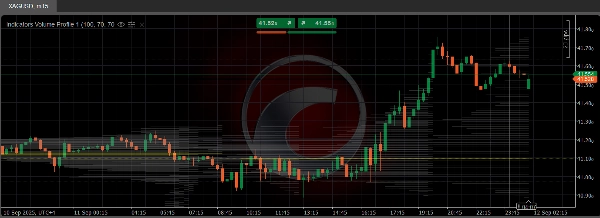
o 🎯 Titik Kontrol (Point of Control - POC):* Indikator ini dengan jelas menunjukkan (dengan garis kuning) level harga di mana volume perdagangan terbesar terjadi. Level ini berfungsi sebagai magnet harga dan area support atau resistance yang sangat penting.
o 📊 Area Nilai (Value Area - VA): Menentukan rentang harga (dengan warna abu-abu) di mana 70% perdagangan terjadi. Perdagangan di atas area ini adalah sinyal bullish kuat, dan perdagangan di bawahnya adalah sinyal bearish.
o 💡 Keputusan trading yang lebih cerdas: Gunakan area ini untuk menentukan titik masuk dengan akurasi tinggi, menempatkan stop loss di tempat yang aman, dan menetapkan target realistis untuk mengambil keuntungan.
---
· Mengapa indikator ini lebih baik?
o Akurasi perhitungan tinggi: Menggunakan algoritma canggih untuk mendistribusikan volume secara akurat pada setiap pergerakan harga, memberikan hasil yang lebih realistis.
o Kemudahan penggunaan: Antarmuka sederhana dan pengaturan jelas memungkinkan Anda menyesuaikan indikator sesuai gaya analisis Anda.
o Performa stabil: Kode dibangun agar ringan dan stabil, memastikan platform cTrader Anda tidak melambat.
Tingkatkan analisis teknikal Anda ke level berikutnya. Mulailah trading berdasarkan data nyata, bukan hanya tebakan. Unduh indikator sekarang.
Ringkasan
Ulasan pelanggan
5 | 0 % | |
4 | 100 % | |
3 | 0 % | |
2 | 0 % | |
1 | 0 % |


