
Trend Pullback Profile
インジケーター
バージョン 1.0、Nov 2025
Windows、Mac
4.5
レビュー: 2
説明
トレンドプルバックプロファイラー
トレンドプルバックプロファイラー は、プルバックの深さと頻度を測定することでトレンドの 呼吸 を分析するために作られた cTrader インジケーターで、現在は フィボナッチリトレースメント% でも表示されます。
EMA ベースのトレンドフィルターを使用して、インジケーターは次のことを行います:
- 明確な 上昇トレンド または 下降トレンド が存在するかを検出します;
- そのトレンド内の各 確定したプルバック を特定します;
- プルバックの 深さをピップスで測定 します;
- 最後のインパルスレッグに対する フィボナッチスタイルのリトレースメント割合 を計算します;
- 次の項目をリアルタイムで追跡します:
-
- 現在のトレンドで発生したプルバックの数、
- 最後の プルバックの深さ、
- 平均 プルバックの深さ、
- 最後の フィボナッチリトレースメント%。
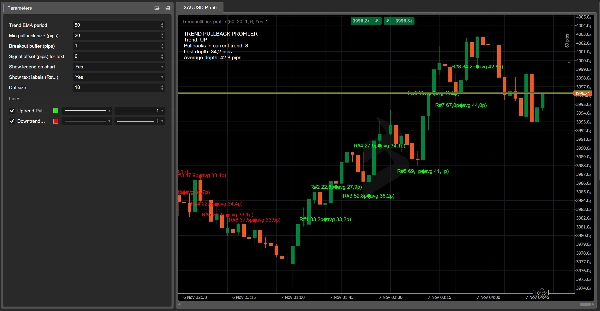
チャート上では、次のことを行います:
- 上昇トレンドのプルバックの安値に 大きな緑の点 をプロットします、
- 下降トレンドのプルバックの高値に 大きな赤い点 をプロットします、
- オプションで次のようなコンパクトなラベルを表示します:
22.5 p / 38.2%。
左上隅には、動的な凡例が表示されます:
- 現在のトレンド方向(上昇 / 下降 / なし);
- 現在のトレンド内のプルバック数;
- 最後のプルバックの深さ(ピップス単位);
- 平均プルバックの深さ(ピップス単位);
- 最後の フィボナッチリトレースメント割合。
主なパラメーター
- トレンドEMA期間
トレンド方向を定義するために使用されるEMA期間。 - 最小プルバックサイズ(ピップス)
有効なリトレースメントとしてカウントするために必要な最小のプルバック深さ(ピップス単位)。 - ブレイクアウトバッファー(ピップス)
新しいレッグを確認しプルバックを終了するために、価格が前のトレンドの極値を超えて動く必要がある追加距離。 - テキスト用シグナルオフセット(ピップス)
プルバックの高値/安値に対するテキストラベルの垂直オフセット。 - チャート上に凡例を表示
トレンド、最後および平均の指標を含むチャート上の凡例の表示を切り替えます。 - 点の近くにテキストラベルを表示
有効にすると、プルバックの深さ(およびオプションでフィボナッチ%)を示す小さなラベルを点の隣に表示します。 - ラベルにフィボナッチ%を表示
有効にすると、ラベルにピップスとフィボナッチ%の両方を表示します(XX.Xp / YY.Y%)。 - 点のサイズ
チャート上の点の大きさを制御し、低い時間足でもプルバックを見つけやすくします。
実用的な使用例
- 特定のシンボル/時間足でプルバックが通常どのくらい深いかを視覚的にプロファイリングする。
- ランダムなレベルではなく、典型的な リトレースメントゾーン周辺でリミットエントリーを計画する。
- 通常より深いプルバック(例えば、61.8%や78.6%を超えるもの)を見つけ、トレンドの疲労 または反転の可能性を示すサインとして活用する。
- トレンドトレーディングのプレイブックに客観的で数値的なプルバックおよびフィボナッチ情報を追加する。
トレンドプルバックプロファイラーでのフィボナッチリトレースメントの計算方法
トレンドプルバックプロファイラーは、任意の高値や安値ではなく、トレンドの最後のインパルスレッグ に基づいてフィボナッチスタイルのリトレースメント割合を計算します。
上昇トレンドの場合
- インジケーターは次の範囲の インパルスレッグ を追跡します:
-
- トレンド基準価格 = 最後の重要な安値(前回のプルバックの終わり)
- トレンド極値 = トレンドの最後のスイング高値
- プルバックが形成されると、インジケーターは次を測定します:
-
- プルバックの深さ(価格):
depthPrice = trendHigh – pullbackLow - インパルスレッグのサイズ:
legSize = trendHigh – trendBasePrice
- プルバックの深さ(価格):
- フィボナッチリトレースメントの割合は次の通りです:
Fib% = (depthPrice / legSize) * 100
したがって、価格が最後のインパルスの約38.2%~50%戻ってから再び上昇する場合、 38.2%、50%、61.8% などの値が表示されます。
下降トレンドの場合
- インパルスレッグは次の範囲で動きます:
-
- トレンド基準価格 = 最後の重要な高値(前回のプルバックの終わり)
- トレンド極値 = トレンドの最後のスイング安値
- プルバックはトレンドに対して 上昇 し、インジケーターは次を測定します:
-
- プルバックの深さ(価格):
depthPrice = pullbackHigh – trendLow - インパルスレッグのサイズ:
legSize = trendBasePrice – trendLow
- プルバックの深さ(価格):
- 同じ式:
Fib% = (depthPrice / legSize) * 100
このようにして、チャート上で見るすべての点は、現在のトレンドの明確なインパルス内の プルバック を表し、ピップス と フィボナッチ% の両方で表現されるため、リトレースメントが浅いか、典型的か、または異常に深いかをすばやく判断できます。
概要
AIによる概要
Trend Pullback Profiler is a cTrader indicator designed to analyze trend behavior by measuring the depth and frequency of pullbacks within a trend. It uses an EMA-based filter to detect clear uptrends or downtrends and identifies confirmed pullbacks during these trends. The indicator measures pullback depth in pips and calculates Fibonacci-style retracement percentages relative to the last impulse leg of the trend.
Key features include:
- Detection of trend direction and pullbacks.
- Measurement of pullback depth and Fibonacci retracement percentage.
- Live tracking of the number of pullbacks, last pullback depth, average pullback depth, and last Fibonacci retracement percentage.
- Visual chart elements such as large green dots at pullback lows in uptrends and large red dots at pullback highs in downtrends.
- Optional compact labels displaying pullback depth and Fibonacci percentage.
- A dynamic legend showing current trend direction, pullback counts, and metrics.
The Fibonacci retracement is calculated based on the last impulse leg, defined by the last significant trend base and extreme prices, providing objective numeric data to assess whether retracements are shallow, typical, or unusually deep. The indicator supports various markets including Forex, indices, commodities, cryptocurrencies, and stocks. It offers configurable parameters such as EMA period, minimum pullback size, breakout buffer, and display options for labels and legend.
インジケーターのプロフィール
カスタマーレビュー
4.5
レビュー: 2
5 | 50 % | |
4 | 50 % | |
3 | 0 % | |
2 | 0 % | |
1 | 0 % |
カスタマーレビュー
November 10, 2025
tested small first and that felt like the right move, and it is just a support layer.
November 10, 2025
ディスカッション
よくあるご質問
BTCUSD
Forex
Signal
Breakout
Indices
EURUSD
Commodities
GBPUSD
NZDUSD
RSI
Martingale
Fibonacci
Prop
Scalping
SMC
Crypto
Grid
Stocks
AI
XAUUSD
NAS100
ATR
USDJPY
cTrader Storeで入手可能な取引ボット、インジケーター、プラグインなどの商品は、第三者の開発者が提供するものであり、情報と技術の取得のみを目的としてご利用いただけます。cTrader Storeはブローカーではなく、投資助言や個人的な推奨を行うことも、将来のパフォーマンスを保証することもありません。


これも好きかも


価格
42.11M
取引数量
6.13M
獲得pips
228
販売
8.47K
無料インストール