SMC + FVG Binary Signal Pro
Indicador
Versão 1.0, Nov 2025
Windows, Mac
4.0
Avaliações: 2
Descrição
SMC + FVG Binary Signal PRO por PrimeQuant
- 🎯 Propósito
Ajuda você a identificar configurações de COMPRA/VENDA com maior probabilidade usando conceitos SMC/ICT mais filtros clássicos de momentum. - 🧠 O que os sinais significam
- FVG (Fair Value Gap): zonas de gap de 3 velas que frequentemente são revisitadas.
- Varredura de liquidez + MSS: o preço atinge uma máxima/mínima recente (paradas) e então recupera/rejeita — um possível sinal de reversão/continuação.
- Pontuação composta combina Momentum / Reversão à Média / Volatilidade / Ação de Preço / SMC para avaliar cada configuração.
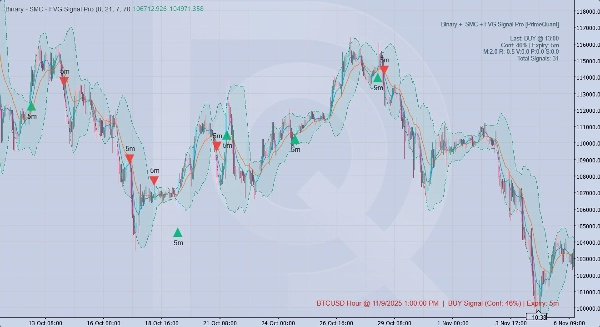
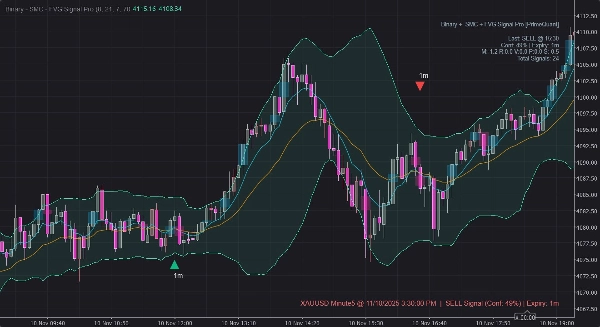
- 📊 No gráfico
- Setas claras para direção e uma pequena dica de expiração (“30s”, “1m”, “5m”, …).
- Nuvem de Bollinger opcional, EMA(8/21), e destaques nas barras (engolfo, explosão ATR).
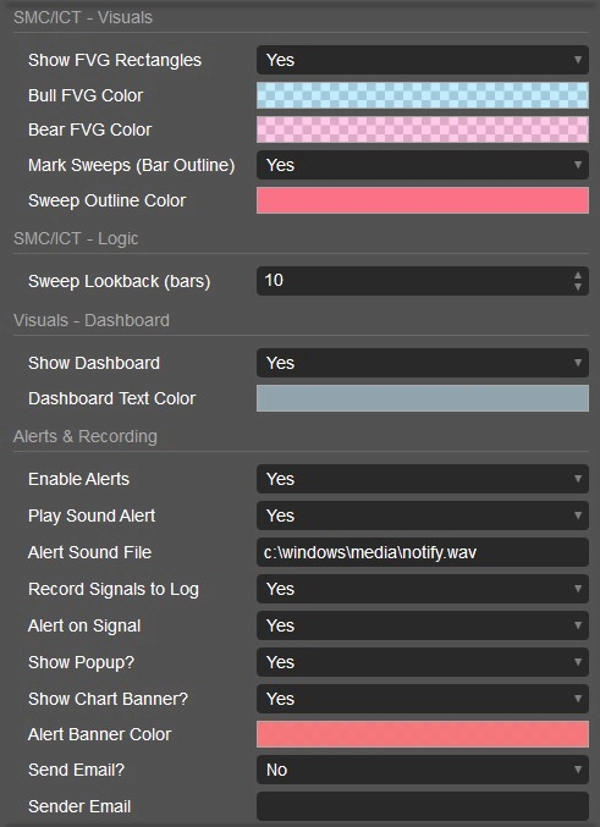
- Retângulos FVG (ligados/desligados) e marcas de varredura para que você veja o contexto rapidamente.
- 🔔 Alertas que você pode usar
- Som (tons embutidos ou personalizados), popup, banner, e-mail opcional.
- Cada alerta inclui hora, símbolo, direção, confiança e expiração sugerida.
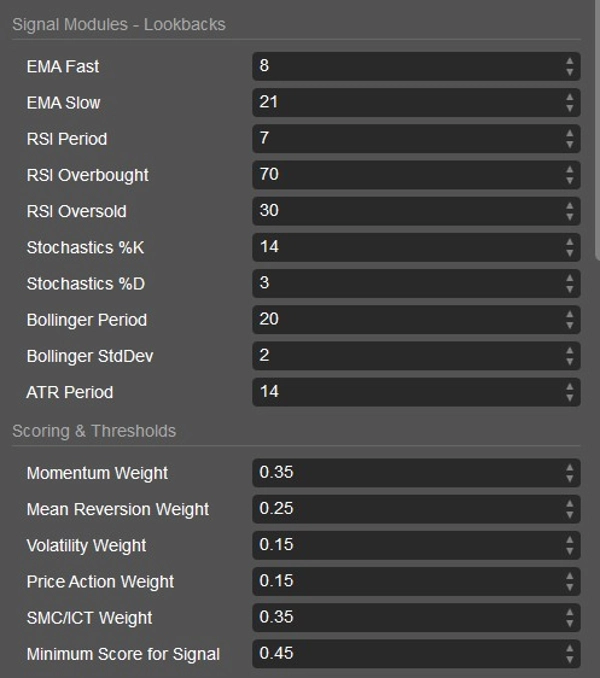
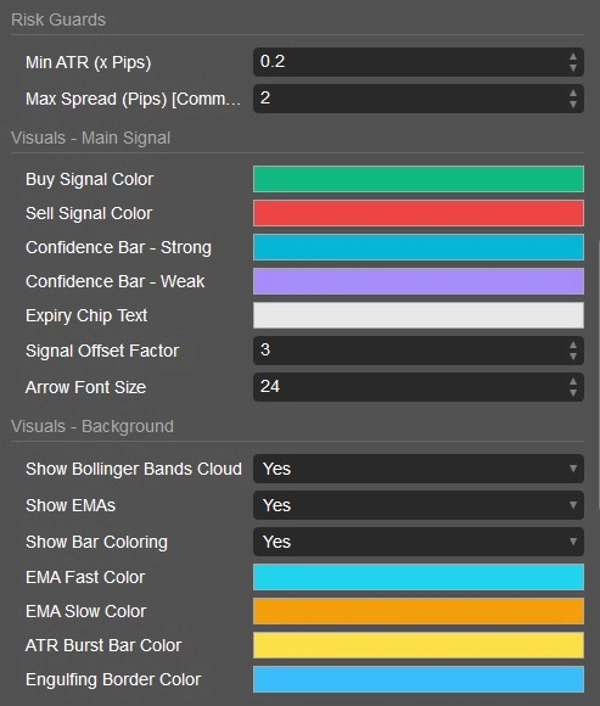
- 🛠️ Configurável, mas sensato por padrão
- Períodos de EMA/RSI/Stoch/BB/ATR.
- Pesos por módulo e limite de pontuação mínima para ajustar o rigor dos sinais.
- Cores, tamanho das setas, texto do painel.
- 📈 Como operar com ele
- Espere por um sinal e uma confirmação de fechamento da barra (rompe a máxima/mínima anterior na direção do sinal).
- Dê prioridade a sinais próximos de FVGs ou após uma varredura+MSS alinhada com a seta.
- Use o painel para verificar os componentes (M/R/V/P/SMC) — evite confluência fraca.
- Gerencie o risco: dimensione pelo ATR/volatilidade e respeite spreads/liquidez da sessão.
- 🧪 Símbolos e prazos
Funciona em Forex, Cripto, Índices, Ações. Comece em M1–M15 para temporização; considere viés de HTF (H1/H4) para direção. - ⚠️ Aviso legal
Esta é uma ferramenta de suporte à decisão, não um conselho financeiro. Teste em demo, entenda a lógica e negocie com responsabilidade.
Resumo
Perfil do indicador
Avaliações de clientes
4.0
Avaliações: 2
5 | 0 % | |
4 | 100 % | |
3 | 0 % | |
2 | 0 % | |
1 | 0 % |
Avaliações de clientes
November 21, 2025
The tool feels better once one first glance should not become the only input. It should stay in the support stack.
November 13, 2025
the part that matters is the setup needs less second guessing, and spread and slippage need a line in the notes.
Conversa
Perguntas frequentes
BTCUSD
Forex
Signal
Breakout
Indices
EURUSD
Commodities
GBPUSD
NZDUSD
RSI
Bollinger
Prop
Scalping
Fair Value Gap
SMC
Crypto
Stocks
XAUUSD
NAS100
ATR
MACD
USDJPY
Os produtos disponíveis através da cTrader Store, incluindo bots de negociação, indicadores e plugins, são fornecidos por programadores terceiros e são disponibilizados apenas para fins informativos e de acesso técnico. A cTrader Store não é um corretor e não fornece aconselhamento em matéria de investimento, recomendações pessoais ou qualquer garantia de desempenho no futuro.


![Logótipo de "[Hamster-Coder] Bollinger Bands"](https://cdn.ctrader.com/image/webp/21d8e5d6-fb11-4bac-b9ee-cd05c2b76804_30327)


Preço
41
Vendas
3.82K
Instalações gratuitas