📈 Indikator Bias Volatilitas Skew – Versi Profesional (untuk cTrader)
Buka pemahaman yang lebih dalam tentang tekanan pasar, ketidakseimbangan volatilitas, dan keyakinan arah dengan Indikator Bias Volatilitas Skew, versi yang ditingkatkan dari pendekatan berbasis volatilitas klasik yang awalnya terinspirasi oleh Pine Script dan sekarang sepenuhnya dioptimalkan untuk cTrader.
Alat ini membantu trader memvisualisasikan sisi pasar mana yang lebih kuat — pembeli atau penjual — dengan mengukur asimetri volatilitas dan mengubahnya menjadi sinyal yang jelas dan mudah dibaca.
Apakah Anda berdagang indeks, forex, komoditas, atau kripto, indikator ini berfungsi sebagai filter tren, detektor rezim, dan alat konfirmasi bias yang kuat.
1. Apa yang Diukur oleh Indikator Skew
Indikator mengevaluasi keseimbangan volatilitas antara candle bullish dan bearish.
Ini menghitung True Range yang dinormalisasi dan memasukkannya ke dalam dua rata-rata adaptif:
- Deviasi Maks → volatilitas yang dihasilkan selama candle naik
- Deviasi Min → volatilitas yang dihasilkan selama candle turun
Kemudian menghitung:
👉 Skew = DeviasiMaks / DeviasiMin
Ini mengubah volatilitas mentah menjadi bacaan arah yang jelas:
- Skew > 1 → pergerakan naik rata-rata lebih kuat
- Skew < 1 → pergerakan turun lebih kuat
- Skew ≈ 1 → volatilitas simetris dan pasar seimbang
Singkatnya:
Skew mengungkapkan sisi mana yang memiliki “dominasi volatilitas”.
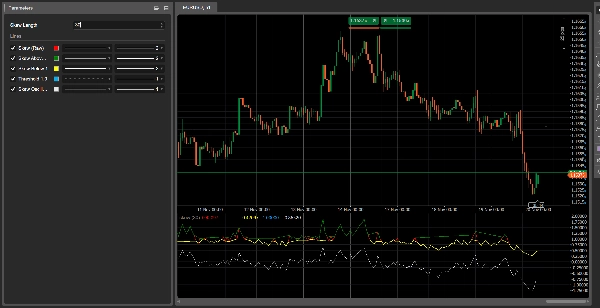
2. Memahami Garis-garis
1. Skew (Mentah) – Garis merah
Rasio volatilitas murni. Ini adalah sinyal inti.
2. Skew Di Atas 1 – Garis hijau
Menunjukkan dominasi volatilitas bullish.
3. Skew Di Bawah 1 – Garis kuning
Menunjukkan dominasi volatilitas bearish.
4. Garis Ambang 1.0 – Garis biru putus-putus
Mewakili keseimbangan.
5. Osilator Skew (log) – Garis putih
Representasi yang lebih stabil dan halus:
- di atas 0 = volatilitas bullish
- di bawah 0 = volatilitas bearish
3. Cara Membacanya
A) Rezim Pasar
🔹 Rezim Bullish
- Skew > 1
- Garis hijau aktif
- Osilator di atas nol
→ Pasar mendukung long.
🔹 Rezim Bearish
- Skew < 1
- Garis kuning aktif
- Osilator di bawah nol
→ Pasar mendukung short.
🔹 Netral
- Skew ≈ 1
→ Pasar seimbang, cocok untuk perdagangan rentang.
4. Sinyal Pergeseran Rezim
Skew menembus di atas 1
→ Pembeli mendapatkan dominasi volatilitas
→ Transisi bullish
Skew menembus di bawah 1
→ Penjual mendapatkan dominasi volatilitas
→ Transisi bearish
Perubahan ini sering terjadi sebelum aksi harga mengonfirmasi tren, menjadikan Skew indikator awal yang kuat.
5. Kasus Penggunaan Praktis
1️⃣ Filter Tren untuk cBots
- berdagang long hanya saat SkewOsc > 0
- berdagang short hanya saat SkewOsc < 0
2️⃣ Konfirmasi Kualitas Tren
- Uptrend + Skew > 1 = tren kuat
- Uptrend + Skew menurun menuju 1 = tren melemah
3️⃣ Sentimen Pasar / Filter Risiko
Sangat efektif pada indeks dan pasangan utama FX.
6. Ringkasan
- Apa yang ditunjukkan: dominasi volatilitas
- Mengapa penting: pergeseran volatilitas mendahului pergeseran harga
- Cara menggunakannya: sebagai filter, alat konfirmasi, atau pengukur sentimen
- Bagian terbaik: sangat ringan, cepat, dan dapat disesuaikan
5 | 67 % | |
4 | 33 % | |
3 | 0 % | |
2 | 0 % | |
1 | 0 % |


![Logo "[CB] Pivot Points Pro"](https://cdn.ctrader.com/image/webp/43463c82-67b0-4f10-a4ba-901bba091d81_32594)