Deskripsi
Currency Basket - Indikator Indeks Komposit Kustom
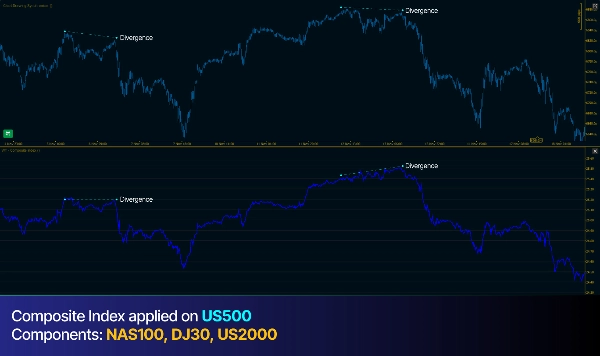
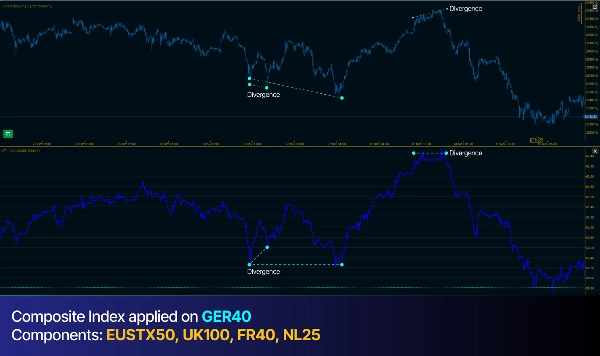
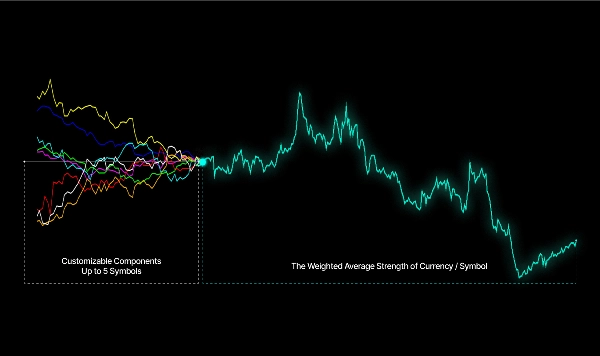
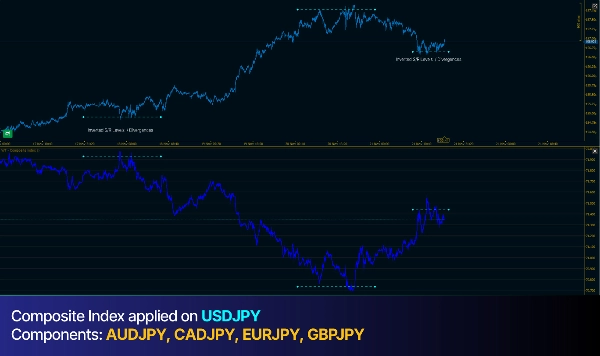
Indikator ini menggabungkan beberapa pasangan mata uang menjadi satu indeks kekuatan komposit, yang ditampilkan di panel terpisah di bawah grafik Anda. Ini secara otomatis mendeteksi titik pivot (fraktal) pada grafik harga Anda dan indeks keranjang, lalu menghubungkannya dengan garis tren untuk mengungkap divergensi.
Versi 2.0 - Lihat Tab Catatan Rilis
Terbuka untuk pembaruan di masa depan
-------------------------------------------------------------------------------------------------------------------------------------------------------
Apa Fungsinya
-------------------------------------------------------------------------------------------------------------------------------------------------------
- Keranjang Komposit: Menggabungkan 5 pasangan mata uang (pilihan Anda) dengan bobot yang sama untuk membuat indeks kekuatan
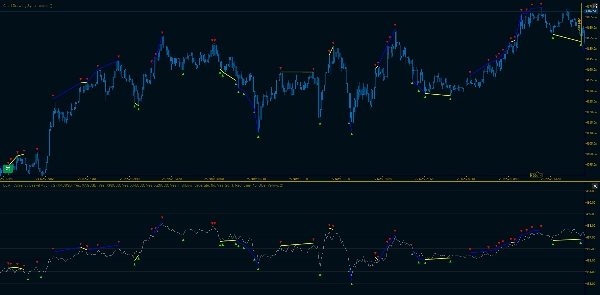
- Deteksi Fraktal Otomatis: Mengidentifikasi titik pivot tertinggi dan terendah pada grafik Anda berdasarkan jumlah bar kiri/kanan yang dapat dikonfigurasi
- Pelacakan Berurutan: Mengikuti titik pivot berturut-turut dari tipe yang sama (tertinggi atau terendah) dan menghubungkannya dengan garis tren
- Penyorotan Divergensi: Secara otomatis mewarnai segmen garis tren kuning saat harga dan keranjang bergerak ke arah berlawanan (divergensi), putih saat mereka bergerak bersama
-------------------------------------------------------------------------------------------------------------------------------------------------------
Beberapa Mode Perhitungan untuk Rata-Rata Tertimbang
-------------------------------------------------------------------------------------------------------------------------------------------------------
- Close: Garis halus tunggal menggunakan harga penutupan
- Weighted (HL2): Garis tunggal menggunakan rata-rata harga tertinggi dan terendah
- High/Low Terpisah: Dua garis—fraktal tinggi dibandingkan dengan tertinggi keranjang, fraktal rendah dengan terendah keranjang
-------------------------------------------------------------------------------------------------------------------------------------------------------
Pengaturan yang Dapat Disesuaikan
-------------------------------------------------------------------------------------------------------------------------------------------------------
- Aktif/nonaktifkan pasangan mata uang individual
- Sensitivitas deteksi pivot yang dapat disesuaikan
- Warna yang dapat dikonfigurasi untuk fraktal, garis tren, dan divergensi
- Opsi inversi untuk menganalisis kekuatan mata uang kuotasi
- Pengali skala untuk tampilan visual optimal
Indikator ini bekerja pada semua kerangka waktu dan secara otomatis mencerminkan semua fraktal dan garis tren yang terdeteksi antara grafik harga Anda dan panel keranjang untuk perbandingan visual yang mudah.
Ringkasan
Ulasan pelanggan
5 | 100 % | |
4 | 0 % | |
3 | 0 % | |
2 | 0 % | |
1 | 0 % |


