Deskripsi
Analisis Volume Profesional dengan Perhitungan Delta Berbasis Lilin Pintar
Buka kekuatan analisis volume tingkat institusional dengan PROFIL VOLUME DELTA LILIN TERPANGKAT, indikator profil volume terpangkat paling canggih untuk cTrader. Dirancang untuk trader serius yang menginginkan wawasan pasar yang tepat, indikator ini mengungkap di mana aktivitas pasar nyata terjadi melalui perhitungan delta berbasis lilin yang cerdas.
🎯 FITUR UTAMA
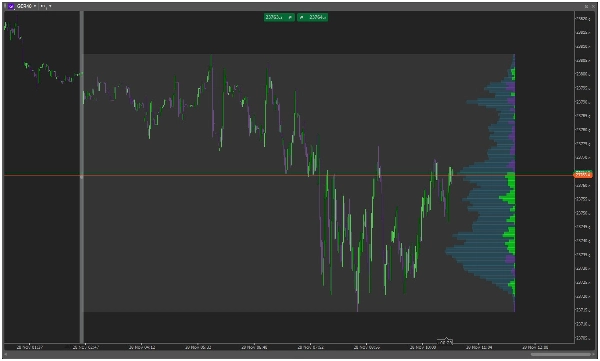
🏓 SISTEM PENGANGKATAN PINTAR
- Cukup gambar garis vertikal di mana saja pada grafik Anda
- Pembuatan profil otomatis terpangkat pada titik pilihan Anda
- Pembaruan dinamis saat aksi harga baru berkembang
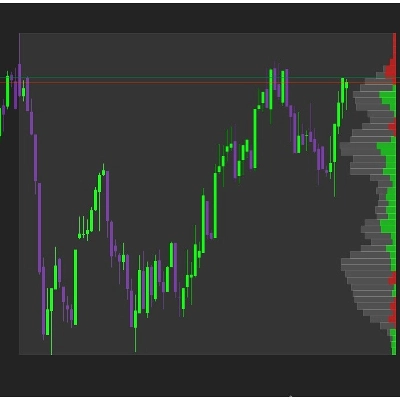
📊 DELTA BERBASIS LILIN YANG CERDAS
- Analisis delta lanjutan berdasarkan arah lilin
- Lilin hijau = Volume Beli | Lilin merah = Volume Jual
- Visualisasi bersih dengan satu warna per tingkat harga
- Identifikasi instan zona tekanan beli/jual
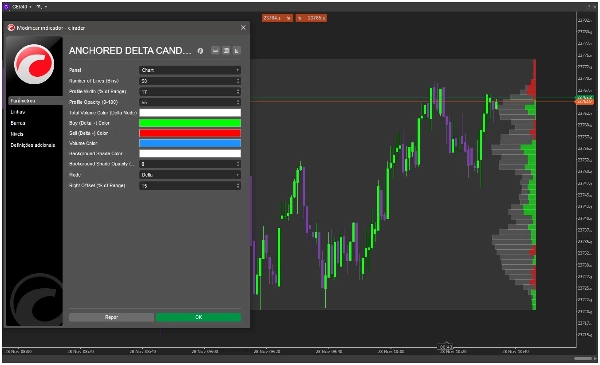
🎨 DESAIN VISUAL YANG DAPAT DISESUAIKAN
- Lebar profil yang dapat disesuaikan (5-100% dari rentang)
- Warna yang dapat disesuaikan untuk volume beli/jual/total
- Kontrol transparansi untuk integrasi grafik yang sempurna
- Pewarnaan profesional untuk keterbacaan yang lebih baik
⚡ MODE TAMPILAN YANG FLEKSIBEL
- Mode Delta: Lihat tekanan beli/jual bersih di setiap tingkat harga
- Mode Volume: Tampilan profil volume tradisional
- Terpangkat kanan untuk pemanfaatan ruang grafik optimal
🚀 MENGAPA TRADER MENYUKAINYA
"Akhirnya, profil volume yang benar-benar berfungsi! Perhitungan delta berbasis lilin sangat akurat untuk mendeteksi aktivitas institusional." - Trader Profesional
"Mengubah permainan untuk analisis profil pasar saya. Sistem pengangkatan sangat brilian dan pendekatan berbasis lilin sangat masuk akal." - Analis Institusional
📈 SEMPURNA UNTUK
- Trader Profil Pasar - Identifikasi area nilai dan puncak/bawah yang buruk
- Teoritis Pasar Lelang - Memahami proses pengembangan pasar
- Strategi Berbasis Volume - Konfirmasi breakout dengan validasi volume
- Analisis Aliran Institusional - Deteksi akumulasi/distribusi uang pintar
🛠 MUDAH DIGUNAKAN
- Gambar garis vertikal di titik pengangkatan Anda
- Amati sebagai PROFIL VOLUME DELTA LILIN TERPANGKAT secara otomatis dibuat
- Analisis distribusi delta di seluruh tingkat harga
- Perdagangan dengan percaya diri menggunakan tingkat yang dikonfirmasi volume
🔧 SPESIFIKASI TEKNIS
- Perhitungan waktu nyata
- Konsumsi sumber daya rendah
- Kompatibel dengan semua kerangka waktu
- Bekerja dengan semua instrumen (Forex, Saham, Kripto, Futures)
📋 PARAMETER YANG TERMASUK
- Jumlah Garis/Bin (5-100)
- Persentase Lebar Profil
- Kontrol Opasitas
- Skema Warna Kustom
- Penyesuaian Offset Kanan
- Mode Tampilan (Delta/Volume)
🎯 TRANSFORMASI ANALISIS GRAFIK ANDA HARI INI!
Bergabunglah dengan ribuan trader profesional yang telah meningkatkan analisis pasar mereka dengan PROFIL VOLUME DELTA LILIN TERPANGKAT. Berhenti menebak dan mulailah melihat di mana aktivitas pasar nyata terjadi melalui perhitungan delta berbasis lilin yang tepat.
⭐ "Kejelasan yang dibawa indikator ini ke analisis volume tidak tertandingi. Pendekatan delta berbasis lilin adalah jenius murni."
Tambahkan PROFIL VOLUME DELTA LILIN TERPANGKAT ke platform cTrader Anda hari ini dan berdagang dengan wawasan tingkat institusional!


![Logo "[Hamster-Coder] Moving Average MTF"](https://cdn.ctrader.com/image/webp/b11b98b1-194d-4b8e-b00e-d611826ad159_31226)


![Logo "[Hamster-Coder] Bollinger Bands"](https://cdn.ctrader.com/image/webp/21d8e5d6-fb11-4bac-b9ee-cd05c2b76804_30327)


