Описание
Delta Volume Indicator - Продвинутый анализ потока ордеров для cTrader
Индикатор Delta Volume анализирует поток ордеров тиковый за тик, чтобы выявить давление покупателей и продавцов, которое не видно только по движению цены. Он вычисляет разницу между upticks (покупками) и downticks (продажами) для каждого бара, предоставляя понимание истинного участия на рынке.
Версия 1.0
Текущая стабильная версия для низких таймфреймов (1м - 15м)
Скоро обновления!
Что делает его уникальным
Анализ на уровне тиков: Не приближение объема - фактическая классификация тиков
Двойные системы дивергенций: Обнаружение дивергенций на уровне баров и на основе фракталов
Проверка качества: Оценка спреда по Corwin-Schultz обеспечивает надежные сигналы
Гибкая визуализация: Несколько методов окраски и опции фильтрации
Полная настройка: Каждый цвет, порог и опция отображения настраиваются
Основан на исследованиях: Построен на рецензируемых исследованиях микроструктуры рынка
------------------------------------------------------------------------------------------------------------------------------------------------------------
Основные функции
------------------------------------------------------------------------------------------------------------------------------------------------------------
Вычисление Delta Volume
- Классификация по правилу тика: Каждый тик классифицируется как покупка (+1), продажа (-1) или нейтральный (0)
- Барная дельта: Чистое давление покупок/продаж на бар = объем покупок - объем продаж
- Накопленная дельта: Накопительная сумма, показывающая устойчивое направленное давление
- Несколько типов цен: Вычисление с использованием Bid, Ask или Mid цен
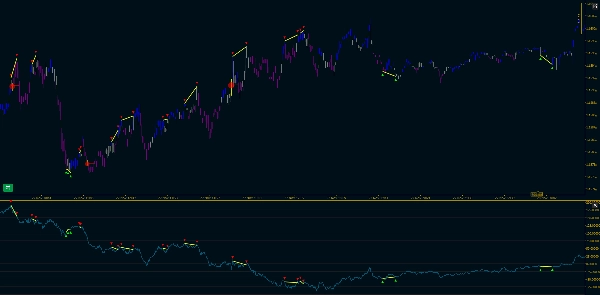
Обнаружение дивергенций Delta
Определяет моменты, когда цена и поток ордеров расходятся — потенциальный сигнал разворота.
Два метода фильтрации:
- Величина + дисбаланс: Прямые пороги для силы дельты и дисбаланса объема
- На основе процентилей: Адаптивная фильтрация на основе исторического распределения
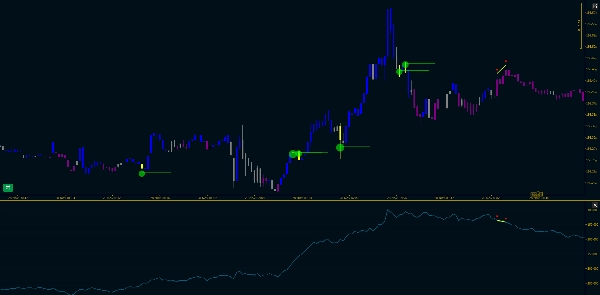
Визуальные маркеры:
- Автоматически размещаются в точке контроля (уровень цены с наибольшим объемом)
- Размер масштабируется в зависимости от величины дельты
- Опциональные трендовые линии, продолжающиеся вперед
Окраска свечей на графике
Окрашивает свечи по потоку ордеров с тремя уровнями приоритета:
- Дивергенция (Желтый) - высший приоритет
- Режим CVD (опционально) - идентификация стабильного режима
- Барная дельта (Лайм/Красный/Серый) - покраска по барам
------------------------------------------------------------------------------------------------------------------------------------------------------------
Анализ режима CVD
------------------------------------------------------------------------------------------------------------------------------------------------------------
Два метода для стабильной окраски:
1. Позиция в диапазоне
- Показывает, где CVD находится в недавнем диапазоне (0-100%)
- Верхние 30% = бычий | Нижние 30% = медвежий | Средние 40% = нейтральный
- Быстрый, интуитивный, самонастраивающийся
2. Фильтр качества Corwin-Schultz
- Использует фактическую оценку спреда Corwin-Schultz по цене
- Доверяет CVD только при высокой ликвидности рынка (узкий спред)
- Автоматически фильтрует ненадежные периоды
- Основан на рецензируемых исследованиях (Corwin & Schultz 2012)
Ключевой принцип: CVD имеет смысл только на ликвидных рынках. Этот метод проверяет качество рынка перед отображением сигналов CVD.
------------------------------------------------------------------------------------------------------------------------------------------------------------
Фрактальный анализ цены и дельты
------------------------------------------------------------------------------------------------------------------------------------------------------------
Одновременно отслеживает поворотные точки как на графике цены, так и на накопленной дельте.
Особенности:
- Обнаруживает фракталы максимумов/минимумов с настраиваемой длиной поворота
- Последовательное отслеживание: следует за последовательными максимумами или минимумами
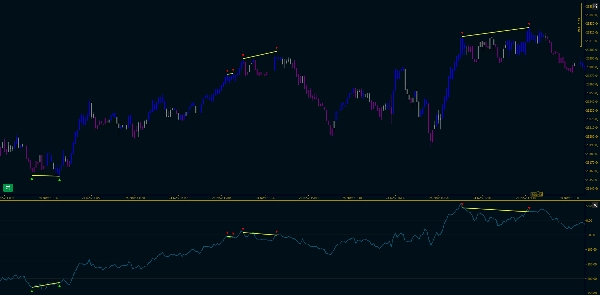
- Обнаружение дивергенций: сравнивает наклон цены и наклон CVD между поворотами
- Двойная визуализация: маркеры и трендовые линии на графике цены и панели индикатора
- Опциональный фильтр: Показывать только дивергентные фракталы для чистого, сфокусированного вида
------------------------------------------------------------------------------------------------------------------------------------------------------------
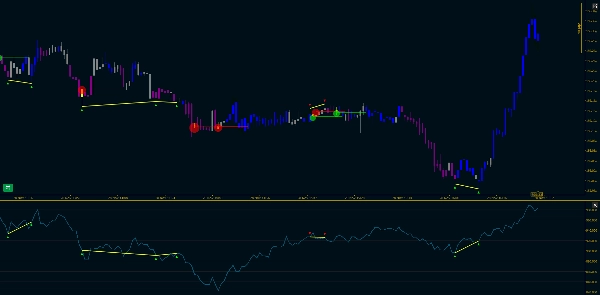
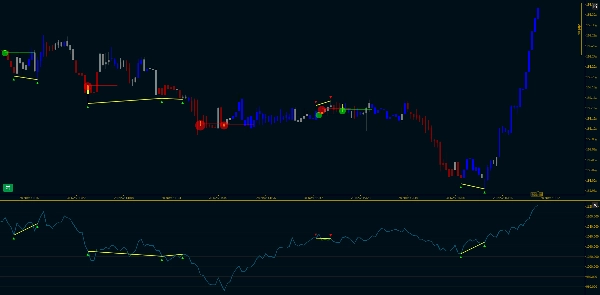
Визуальный вывод
------------------------------------------------------------------------------------------------------------------------------------------------------------
Панель индикатора
- Гистограмма дельты: Белые бары (нормальные), желтые бары (дивергенции)
- Линия накопленной дельты: Голубая линия, показывающая текущий поток ордеров
- Линия нулевой отметки: Серая пунктирная линия
- Фрактальные маркеры: ▼ (максимумы) и ▲ (минимумы) с трендовыми линиями
График цены
- Окрашенные свечи: Визуальное представление режима потока ордеров
- Фрактальные маркеры: Синхронизированы с панелью индикатора
- Фрактальные трендовые линии: Соединяют поворотные точки с выделением дивергенций
- Маркеры дивергенций: Круги в точке контроля
------------------------------------------------------------------------------------------------------------------------------------------------------------
Ссылки
------------------------------------------------------------------------------------------------------------------------------------------------------------
- Corwin, S. A., & Schultz, P. (2012). "A Simple Way to Estimate Bid-Ask Spreads from Daily High and Low Prices." The Journal of Finance, 67(2), 719-760.
- López de Prado, M. (2018). Advances in Financial Machine Learning, Глава 19.
- Lee, C. M., & Ready, M. J. (1991). "Inferring Trade Direction from Intraday Data." The Journal of Finance, 46(2), 733-746.


