Deskripsi
Analisis Volume Berbasis Rentang Profesional dengan Perhitungan Delta Lilin Cerdas
Buka kekuatan analisis volume yang tepat dengan RANGE DELTA CANDLE VOLUME PROFILE, indikator profil volume berbasis rentang terbaik untuk cTrader. Dirancang untuk trader yang membutuhkan analisis volume yang fleksibel dan akurat di berbagai rentang waktu khusus, indikator ini memberikan wawasan tingkat institusional melalui perhitungan delta berbasis lilin yang cerdas.
🎯 FITUR UTAMA
🏓 PENENTUAN RENTANG YANG FLEKSIBEL
- Gunakan garis tren untuk menentukan rentang waktu khusus APA SAJA
- Pembuatan profil dinamis antara titik yang Anda pilih
- Pembaruan waktu nyata saat pasar berkembang
- Opsi penentuan jangkar Kiri atau Kanan
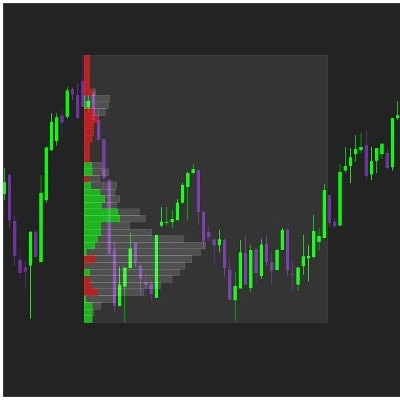
📊 ANALISIS DELTA BERBASIS LILIN CERDAS
- Perhitungan delta lanjutan berdasarkan arah lilin
- Lilin hijau = Volume Beli | Lilin merah = Volume Jual
- Visualisasi bersih dengan satu warna per tingkat harga
- Identifikasi instan zona akumulasi/distribusi
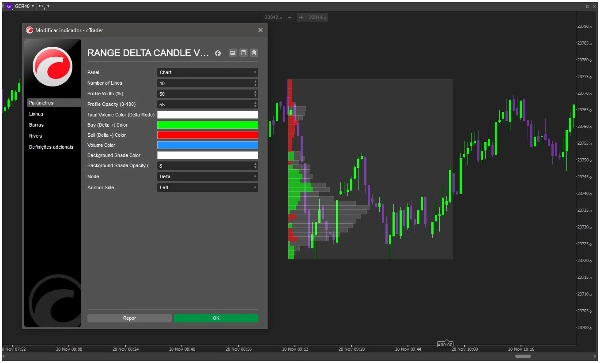
🎨 TAMPILAN YANG SEPENUHNYA DAPAT DISESUAIKAN
- Jumlah bin/garis yang dapat disesuaikan (5-100)
- Lebar profil yang dapat disesuaikan (5-300% dari rentang)
- Kontrol warna lengkap untuk volume beli/jual/total
- Pengaturan transparansi dan opasitas
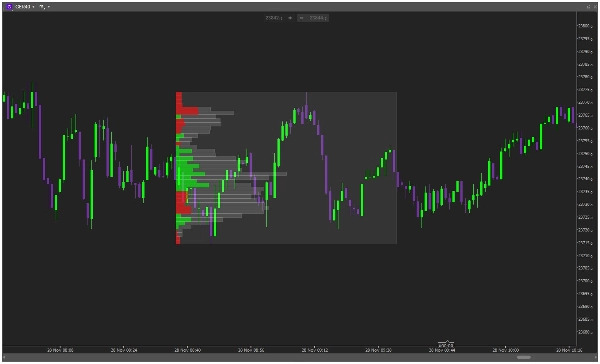
⚡ MODE TAMPILAN GANDA
- Mode Delta: Visualisasikan tekanan beli/jual bersih
- Mode Volume: Tampilan profil volume tradisional
- Pilih antara penentuan jangkar Kiri atau Kanan
🚀 MENGAPA TRADER MEMILIH INI
"Fleksibilitas untuk menganalisis rentang khusus apa pun sangat mengubah permainan. Sempurna untuk analisis sesi dan pergerakan pasar utama." - Trader Hari Profesional
"Akhirnya, profil volume rentang yang benar-benar masuk akal. Delta berbasis lilin sangat akurat." - Trader Swing
📈 IDEAL UNTUK
- Analisis Sesi - Menganalisis sesi perdagangan tertentu (London, NY, Asia)
- Perdagangan Berbasis Acara - Mempelajari volume di sekitar berita dan data ekonomi
- Analisis Teknikal - Mengonfirmasi support/resistance dengan validasi volume
- Struktur Pasar - Mengidentifikasi area nilai dan celah volume
🛠 MUDAH DIGUNAKAN
- Gambar garis tren antara titik awal dan akhir Anda
- Amati sebagai profil volume yang secara otomatis dibuat
- Analisis distribusi delta di seluruh rentang khusus Anda
- Perdagangan dengan level dan wawasan yang dikonfirmasi volume
🔧 SPESIFIKASI TEKNIS
- Perhitungan dan pembaruan waktu nyata
- Konsumsi sumber daya rendah
- Kompatibel dengan semua kerangka waktu
- Bekerja dengan semua instrumen perdagangan
📋 OPSI KUSTOMISASI
- Jumlah Bin/Garis
- Persentase Lebar Profil
- Kontrol Opasitas (0-100%)
- Skema Warna Kustom
- Pemilihan Sisi Jangkar (Kiri/Kanan)
- Mode Tampilan (Delta/Volume)
🎯 TINGKATKAN ANALISIS PASAR ANDA HARI INI!
Bergabunglah dengan trader profesional di seluruh dunia yang telah mengubah analisis pasar mereka dengan RANGE DELTA CANDLE VOLUME PROFILE. Berhenti menggunakan alat rentang tetap yang kaku dan mulai analisis volume tepat di tempat Anda membutuhkannya.
⭐ "Kemampuan untuk menganalisis rentang khusus dengan perhitungan delta yang akurat telah sepenuhnya mengubah cara saya mendekati struktur pasar. Alat yang penting!"
Tambahkan RANGE DELTA CANDLE VOLUME PROFILE ke platform cTrader Anda hari ini dan kuasai analisis volume di berbagai kondisi pasar!
🆚 MENGAPA MEMILIH INI DARIPADA PROFIL VOLUME LAIN?
- ✅ Fleksibilitas Sejati - Menganalisis rentang waktu khusus APA SAJA
- ✅ Delta Akurat - Perhitungan berbasis lilin untuk hasil yang dapat diandalkan
- ✅ Visualisasi Profesional - Tampilan bersih, tingkat institusional
- ✅ Kustomisasi Nyata - Kontrol penuh atas semua aspek visual
- ✅ Metodologi Terbukti - Berdasarkan prinsip perdagangan profesional
Ubah analisis grafik Anda dengan kekuatan profil volume berbasis rentang yang fleksibel!


