Deskripsi
Deskripsi singkat
Peta Rezim Tren & Volume adalah filter rezim untuk cTrader yang mengukur arah dan ketahanan baik harga maupun volume. Ini memberikan skor tren yang dinormalisasi dan skor tren volume dalam rentang –10 hingga +10, mewarnai lilin Anda dengan gradasi halus dari merah bearish ke hijau bullish, dan menunjukkan apakah lingkungan saat ini adalah risiko-aktif, risiko-nonaktif, atau hanya berisik.
🧠 Apa yang dilakukannya
Indikator ini mereplikasi logika “Filter Rezim” BigBeluga dari TradingView, yang disesuaikan untuk cTrader dan dibungkus dalam peta rezim tren & volume yang jelas.
Harga & volume yang dihaluskan
- Menghitung HLC3 (rata-rata dari High, Low, Close) dan menerapkan Hull Moving Average (HMA) untuk menghaluskan harga.
- Menerapkan Hull Moving Average lain pada volume tick.
Skor tren (harga)
- Untuk N bar terakhir (
Length), membandingkan HMA harga saat ini dengan setiap nilai HMA masa lalu:
- Jika HMA saat ini > HMA masa lalu → tren +1
- Jika HMA saat ini ≤ HMA masa lalu → tren –1
- Skor yang terkumpul diskalakan ke –10 … +10 → ini adalah Nilai Tren.
Skor tren volume
- Menggunakan logika yang sama, tetapi diterapkan pada HMA volume.
- Hasilnya adalah skor normalisasi lain dalam –10 … +10 → Nilai Volume.
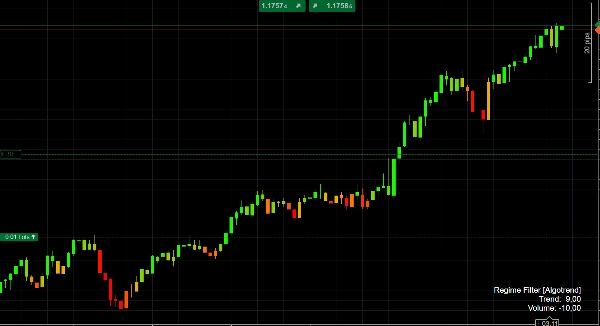
Logika warna
- Ketika Skor Tren negatif, lilin diberi warna dengan gradasi merah → oranye tergantung seberapa kuat rezim turunannya.
- Ketika Skor Tren positif, lilin diberi warna oranye → hijau limau, dengan hijau yang lebih kuat untuk rezim naik yang lebih kuat.
Ini memberi Anda petunjuk visual instan apakah aksi harga bearish, netral, atau bullish, dan seberapa tahan rezim tersebut saat ini.
Panel rezim
Di jendela bawah, indikator menggambar:
- Garis Tren (biru)
- Garis tren Volume (abu-abu)
- Garis Nol (garis dasar)
Pada bar terakhir, mencetak panel info kecil dengan nilai Tren dan Volume saat ini.
🎯 Cara Anda dapat menggunakannya
Konfirmasi Tren
- Perdagangkan hanya dalam arah rezim yang kuat, misalnya:
- Tren > +4 → bias hanya beli
- Tren < –4 → bias hanya jual
Filter Rezim
- Matikan atau kurangi strategi Anda saat rezim lemah (Tren mendekati 0) atau saat tren Volume sangat negatif, yang sering menandakan pergerakan yang berombak atau memudar.
Konteks untuk sinyal
Gabungkan sinyal masuk yang sudah ada (aksi harga, pola harmonik, osilator, dll.) dengan Peta Rezim Tren & Volume sebagai filter makro:
- Hanya ambil breakout saat Tren positif dan tren Volume juga positif.
- Hindari setup mean-reversion saat Tren sangat kuat (> +8 atau < –8), karena pasar berada dalam rezim arah yang kuat.
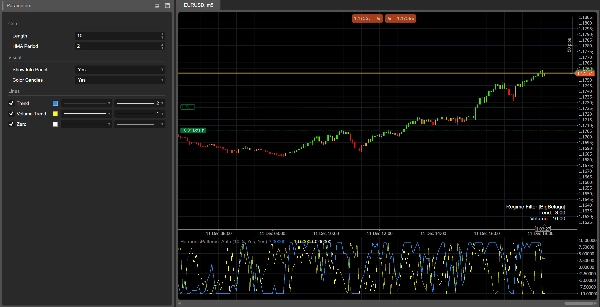
⚙️ Parameter input
Inti
Length
Jumlah bar yang digunakan untuk membangun skor tren dan volume.
- Nilai lebih tinggi → rezim yang lebih halus dan “makro”; lebih lambat berubah tetapi lebih stabil.
- Nilai lebih rendah → respons lebih cepat, tetapi lebih banyak kebisingan dan perubahan yang lebih sering.
Periode HMA
Periode Hull Moving Average yang digunakan untuk menghaluskan harga dan volume.
- Sesuaikan dengan kerangka waktu dan gaya trading Anda: lebih pendek untuk kerangka waktu rendah, lebih panjang untuk kerangka waktu tinggi.
Visual
Tampilkan Panel Info
Menampilkan/menyembunyikan panel teks kecil pada bar terakhir dengan skor Tren dan Volume saat ini.Warna Lilin
Mengaktifkan pewarnaan lilin berdasarkan nilai Tren (gradasi merah / oranye / hijau). Matikan jika Anda lebih suka mempertahankan warna grafik default Anda.
✅ Daftar singkat interpretasi
- Tren ≥ +7 → rezim bullish kuat, lilin hijau cerah.
- Tren antara +3 dan +7 → bias bullish; pullback adalah zona potensi beli saat turun.
- Tren antara –3 dan +3 → sideways / berombak; sinyal kurang dapat diandalkan.
- Tren ≤ –7 → rezim bearish kuat, lilin merah pekat.
- Tren volume > 0 → aktivitas naik / berkelanjutan, pergerakan lebih mungkin “nyata” dan bertahan lama.
- Tren volume < 0 → partisipasi menurun, risiko lebih tinggi untuk pergerakan palsu, berombak, atau pembalikan.
Ringkasan
Ulasan pelanggan
5 | 0 % | |
4 | 100 % | |
3 | 0 % | |
2 | 0 % | |
1 | 0 % |


