Deskripsi
Kekuatan Pasangan (JPY) - Indikator Kekuatan Mata Uang
📊 Apa itu Kekuatan Pasangan (JPY)?
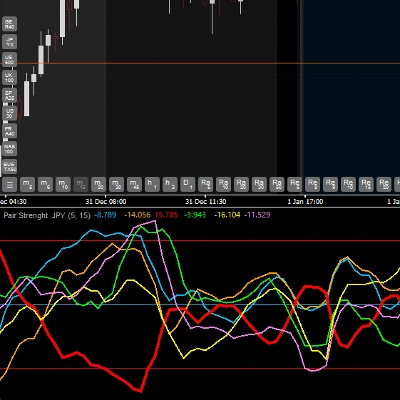
Kekuatan Pasangan (JPY) adalah indikator canggih yang menganalisis dan membandingkan kekuatan relatif dari 6 mata uang utama secara real-time: EUR, GBP, JPY, USD, AUD, dan CAD. Ini menggunakan True Strength Index (TSI) untuk mengukur momentum dan kekuatan masing-masing mata uang, memungkinkan Anda mengidentifikasi mata uang mana yang lebih kuat atau lebih lemah di pasar.
🎯 Fitur Utama
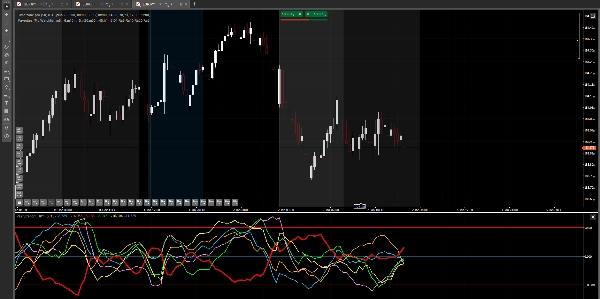
✅ Analisis Multi-Mata Uang: Pantau 6 mata uang secara bersamaan dalam satu jendela ✅ Identifikasi Tren: Deteksi mata uang terkuat dan terlemah di pasar ✅ Sinyal Overbought/Oversold: Level di 50, 0, dan -50 untuk mengidentifikasi kondisi ekstrem ✅ Konfirmasi Perdagangan: Membantu memvalidasi entri Anda dengan membandingkan kekuatan relatif ✅ Visual dan Jelas: Setiap mata uang memiliki warna sendiri untuk identifikasi mudah
💹 Pasangan yang Kompatibel
PENTING: Indikator ini menganalisis kekuatan 6 mata uang: EUR, GBP, JPY, USD, AUD, dan CAD
Indikator bekerja HANYA dengan pasangan yang mencakup JPY (Yen Jepang), artinya:
- EURJPY (Euro / Yen)
- GBPJPY (Pound / Yen)
- USDJPY (Dollar / Yen)
- AUDJPY (Dollar Australia / Yen)
- CADJPY (Dollar Kanada / Yen)
⚠️ Broker Anda HARUS menawarkan 5 pasangan ini dengan JPY agar indikator dapat bekerja dengan benar.
Tidak bekerja dengan:
- Emas, perak, atau logam lainnya
- Indeks saham
- Cryptocurrency
- Pasangan yang tidak termasuk JPY (seperti EURUSD, GBPUSD, dll.)
Anda dapat menerapkan indikator pada grafik salah satu dari 5 pasangan yang disebutkan di atas.
📈 Cara Menggunakan Indikator
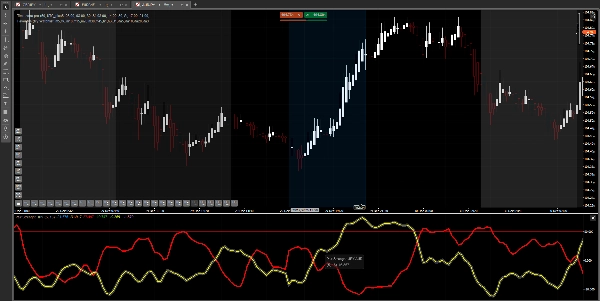
Interpretasi Garis:
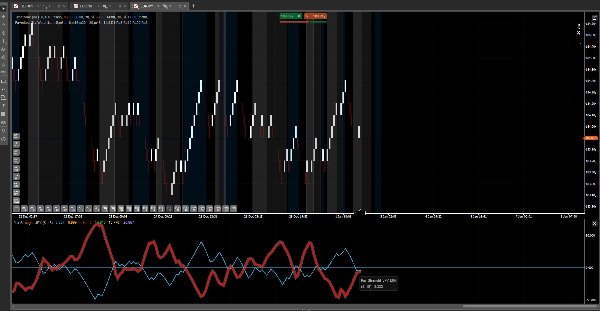
Setiap garis berwarna mewakili kekuatan sebuah mata uang:
- Garis naik (nilai positif): Mata uang KUAT
- Garis turun (nilai negatif): Mata uang LEMAH
- Persilangan garis: Perubahan kekuatan relatif antar mata uang
Level Kunci:
- Level 50: Zona overbought - Mata uang mungkin sangat kuat dan mendekati pembalikan
- Level 0: Garis netral - Keseimbangan antara kekuatan dan kelemahan
- Level -50: Zona oversold - Mata uang mungkin sangat lemah dan mendekati pembalikan
Strategi Dasar:
- Identifikasi mata uang TERKUAT (garis tertinggi)
- Identifikasi mata uang TERLEMAH (garis terendah)
- Perdagangkan pasangan yang menggabungkan keduanya (contoh: jika EUR kuat dan JPY lemah → beli EURJPY)
- Konfirmasi dengan level: Hindari membeli saat mata uang kuat berada di +50 atau menjual saat yang lemah di -50
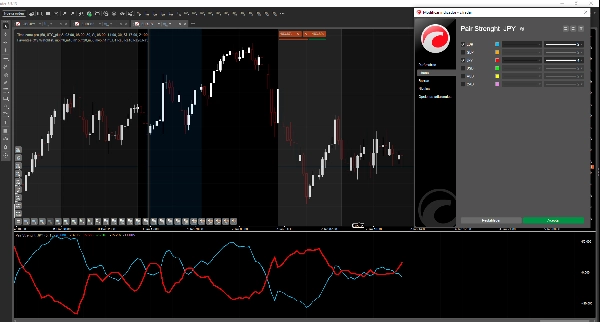
⚙️ Parameter yang Dapat Disesuaikan
- Periode Cepat (Default: 5): Periode cepat TSI - nilai lebih rendah = lebih sensitif
- Periode Lambat (Default: 15): Periode lambat TSI - nilai lebih tinggi = lebih halus
Nilai default bekerja dengan baik untuk sebagian besar situasi. Sesuaikan sesuai gaya trading Anda.
🔮 Pembaruan Mendatang
Kami sedang mengevaluasi kemungkinan menambahkan lebih banyak pasangan mata uang (NZD, CHF, dll.) dalam versi mendatang, tergantung pada respons dan umpan balik pengguna. Namun, ini tidak dijamin dan akan bergantung pada kinerja indikator dan permintaan pasar.
💡 Tips Penggunaan
✓ Gunakan bersama dengan strategi utama Anda, bukan sebagai sistem mandiri ✓ Gabungkan dengan analisis aksi harga dan level support/resistance ✓ Latihan terlebih dahulu di akun demo sebelum trading live ✓ Tidak semua sinyal menang - terapkan manajemen risiko yang tepat ✓ Bekerja terbaik pada timeframe M15 ke atas
📞 Dukungan
Jika Anda memiliki pertanyaan tentang instalasi atau penggunaan indikator, hubungi kami.
Catatan Akhir: Indikator ini adalah alat analisis. Keberhasilan trading bergantung pada banyak faktor termasuk manajemen risiko, psikologi, dan pengalaman.
Ringkasan
This tool works exclusively with currency pairs that include the Japanese Yen (JPY), specifically EURJPY, GBPJPY, USDJPY, AUDJPY, and CADJPY. It does not support metals, stock indices, cryptocurrencies, or pairs without JPY. Users apply the indicator on any of the five JPY pairs to monitor multi-currency strength simultaneously in one window.
Adjustable parameters include the fast and slow periods of the TSI for sensitivity and smoothing. The indicator aids in trend identification, overbought/oversold signal detection, and trade confirmation by comparing relative currency strength. It is recommended for use alongside other analysis methods and on timeframes of 15 minutes or higher.
Ulasan pelanggan
5 | 100 % | |
4 | 0 % | |
3 | 0 % | |
2 | 0 % | |
1 | 0 % |


