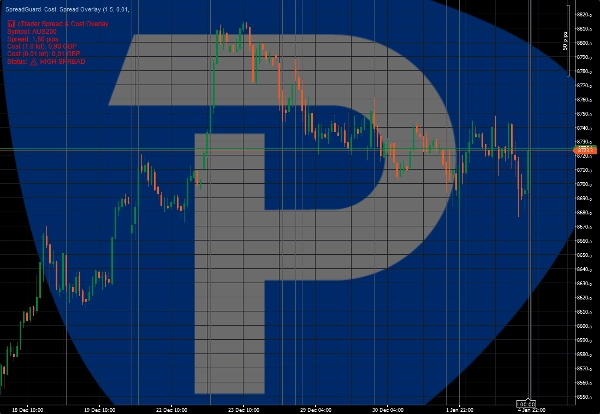
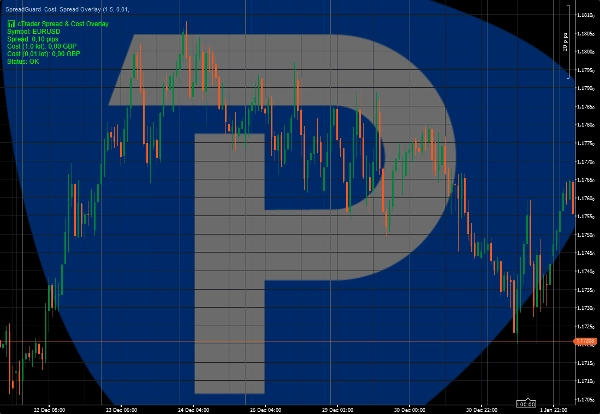
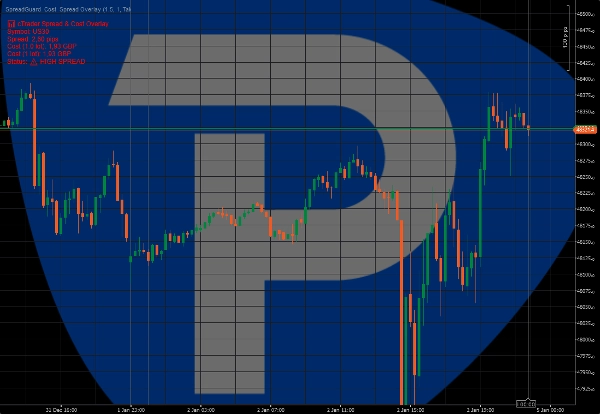
Broker & Prop
Untuk bisnis
00
Days
:
00
Hours
:
00
Minutes
:
00
Seconds
Indikator
Prop
ATR
Forex
EURUSD
GBPUSD
SpreadGuard Cost Spread Overlay
09/01/2026
Desktop
Sejak 02/01/2026
Gambar unggahan "SpreadGuard  Cost  Spread Overlay"Gambar unggahan "SpreadGuard  Cost  Spread Overlay"Gambar unggahan "SpreadGuard  Cost  Spread Overlay"

cTrader Spread & Cost Overlay is a lightweight indicator designed to visualize real-time trading costs directly on the chart.

The indicator shows the current spread in pips and calculates the estimated cost of a trade based on the selected lot size. A visual warning highlights periods of high spread, helping traders avoid unfavorable execution conditions.

Key features:
• Live spread display (pips)
• Estimated trade cost for selected lot size
• Visual warning when spread exceeds a defined threshold
• Clean on-chart overlay

This indicator does not place trades or generate trading signals.
It is intended as an execution and risk-awareness tool for manual traders.

Suitable for scalpers, intraday traders, and prop firm accounts.

*Early access price. Future updates may be released at a higher regular price.

0.0
Ulasan: 0
Ulasan pelanggan
Belum ada ulasan untuk produk ini. Sudah mencobanya? Jadilah pemberi ulasan pertama!
Produk lain dari penulis ini
Indikator
NAS100
Indices
XAUUSD
+6
SessionGuard - Session High-Low Box
Visual session structure showing Asia, London and New York high/low ranges directly on the chart.
Indikator
NAS100
Indices
XAUUSD
+6
NewsGuard High-Impact News Risk Overlay
Visual warning zones for high-impact news so you can manage risk before volatility hits.
Anda mungkin juga suka
Indikator
Scalping
Nadaraya-Watson Kernel Regression
Ultra-smooth adaptive trend line via Gaussian kernel regression — low lag, clean structure.
Indikator
NAS100
NZDUSD
XAUUSD
+12
Volume Meter
Volume Meter
Indikator
NAS100
NZDUSD
Breakout
+13
ADX
Spot strong trends and market direction with precision using this professional-grade ADX indicator.
xhobaniFX_Anchored VWAP
xhobaniFX_Anchored VWAP: Volume Weighted Average
Indikator
Indices
FVG
Commodities
+4
FAIR VALUE GAP INDICATOR
Pinpoint FVGs, track fills and see mitigation stats — trade imbalances with clarity and confidence.
Indikator
NAS100
NZDUSD
XAUUSD
+12
WT - Amplitude - Momentum Detection
Experience a new approach with amplitude-based momentum analysis. Smart Trend Detection That Adapts to Market Volatility
Indikator
Breakout
Fibonacci
Initial Balance
Track Initial Balance ranges across any period with optional Fibonacci levels and projections.
Indikator
RSI
XAUUSD
Breakout
+5
Dynamic Range MomentumI
This histogram helps visualize the strength and direction of market movements, making it easier to spot potential trends
Tabajara corrigido[fix]
corrigido todos os bugs e cores invertidas tabajara antigo deleetado
Fibonacci Pitchfan
Powerful all-in-one tool for traders seeking a clear, dynamic view of market structure. By merging pivots, trendlines &
Peringkat teratas
Gratis
Indikator
ATR
Forex
Signal
+4
Follow Line
The Follow Line Indicator is a versatile tool designed to identify market trends and provide accurate buy/sell signals.
Goldenhours
The Session Golden Hours indicator is designed for serious traders looking to visualize high-probability
Indikator
Indices
Stocks
Commodities
+2
Moving Average Channel
Price channel system built on moving averages—track trend direction, momentum shifts, and mean reversion zones.
Indikator
Indices
Commodities
Forex
+2
Advanced Swings
ICT Advanced Swings Indicator – Multi-Timeframe Precision
ZigZagSmartAlert_demo
ZigZag Smart Alert DEMO for cTrader DEMO VERSION 24 hours free trial! This is a DEMO version of the ZigZag Smart Aler
Indikator
VWAP
Indices
RSI
+4
ProVWAP
Advanced Anchored VWAP for cTrader: volatility bands, real‑time alerts & customizable session resets.
Indikator
NAS100
NZDUSD
XAUUSD
+12
WT - Hawkes Process
Identifies market compression zones and explosive Breakout moments using mathematical modeling.
Indikator
Indices
Prop
Breakout
+7
NTNPICLL
NTNPICLL is a tool to check the best trading hours for the assets and also includes the highest and lowest point