说明
━━━━━━━━━━━━━━━━━━━━━━━━━━━━━━━━━━━━━━━━
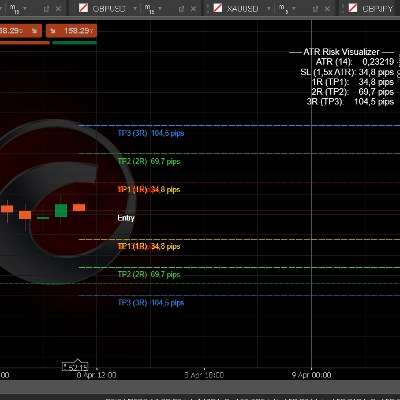
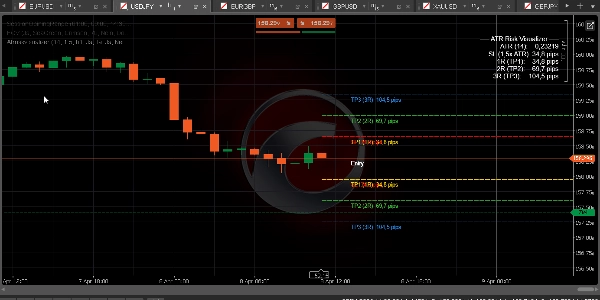
ATR风险可视化工具 — 风险
━━━━━━━━━━━━━━━━━━━━━━━━━━━━━━━━━━━━━━━━
基于ATR即时可视化您的止损和止盈水平 — 具有完整的R倍数映射(1R至5R)和点数标签 — 让您在入场前始终以定义的风险进行交易。
─────────────────────────────
主要功能
► 基于ATR的止损 — 止损距离计算为ATR × 可配置倍数(默认1.5×)
► R倍数止盈 — 自动从当前价格绘制TP1(1R)、TP2(2R)、TP3(3R)、TP4(4R)、TP5(5R)
► 每个水平的点数标签 — 一目了然查看止损和每个止盈的精确点数距离
► 多头和空头水平同时显示 — 或切换为仅多头或仅空头模式
► ATR时间框架选择器 — 从更高时间框架计算ATR(例如M15图表上的H1 ATR)
► ATR信息面板(右上角) — 显示ATR值、止损大小及TP1/2/3的点数
► 完全颜色控制 — 通过原生cTrader颜色选择器分别设置止损、TP1、TP2、TP3、TP4/5的颜色
► 可配置线条样式(实线/虚线/点线)和粗细
► 以卖价或买价作为入场参考 — 根据您的交易方向选择
─────────────────────────────
默认设置
→ ATR周期 14
→ ATR倍数 1.5×(止损 = 1.5 × ATR)
→ ATR时间框架 H1
→ 显示TP1/2/3 开启
→ 显示TP4/5 关闭
→ 方向 双向(多头 + 空头)
→ 止损颜色 红色
→ TP1颜色 金色
→ TP2颜色 酸橙绿
→ TP3颜色 道奇蓝
→ 线条样式 虚线
─────────────────────────────
使用方法
1. 将指标添加到任意图表
2. 设置ATR周期和倍数以匹配您的策略(1.5× ATR是外汇/黄金的标准)
3. 将ATR时间框架设置为H1或H4以获得更平滑的止损大小
4. 直接从图表标签读取点数值
5. 使用TP1(1R)进行首次部分退出,TP2(2R)用于保本,TP3(3R)为完全目标
6. 结合BOS/CHoCH和FVG指标,完成SMC入场工作流程
─────────────────────────────
适用对象
✔ 需要精确计算风险的FTMO和自营交易员
✔ 使用R倍数进行交易管理的SMC和ICT交易员
✔ 任何时间框架的外汇、黄金和指数交易员
✔ 希望在每次入场前拥有清晰视觉风险地图的交易员
✔ 任何构建系统化仓位规模方法的人
─────────────────────────────
兼容性
→ 平台 cTrader(桌面版和网页版)
→ 资产类别 外汇、指数、大宗商品、加密货币差价合约
→ 时间框架 全部(M1至MN)
→ 访问权限 无需权限
→ 账户类型 实盘和模拟盘
━━━━━━━━━━━━━━━━━━━━━━━━━━━━━━━━━━━━━━━━
摘要
客户评价
5 | 50 % | |
4 | 50 % | |
3 | 0 % | |
2 | 0 % | |
1 | 0 % |