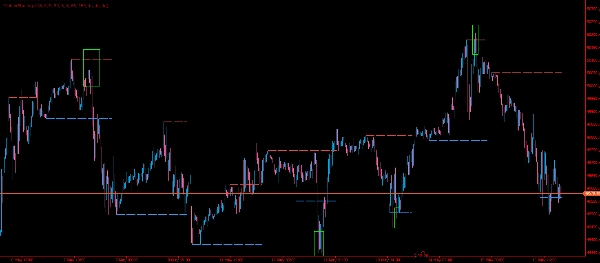
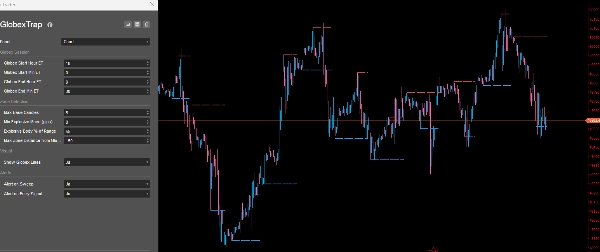
Trading product for GlobexTrap Indikator Market Structure, image 1
Indikator
Versi 1.0, May 2026
Windows, Mac
Trading product for GlobexTrap Indikator Market Structure, image 2
Trading product for GlobexTrap Indikator Market Structure, image 3
Sejak 21/02/2025
466.3M
Volume trading
180.83K
Pip dimenangkan
21
Penjualan
6.72K
Instal gratis

Strategi Perangkap Globex memetakan rentang sesi semalam (default 18:00–09:30 ET) dengan melacak tertinggi tertinggi dan terendah terendah yang terbentuk sebelum pembukaan New York. Setelah sesi NY dimulai, strategi ini mengamati sweep — sebuah sumbu yang menembus Tinggi atau Rendah Globex tetapi menutup kembali di dalam rentang, menandakan pengambilan likuiditas terhadap stop yang diam. Setelah sweep dikonfirmasi, strategi ini memindai setiap bar yang tertutup untuk zona pasokan di atas Tinggi Globex atau zona permintaan di bawah Rendah Globex, yang dibangun berdasarkan struktur Rally-Base-Drop atau Drop-Base-Rally klasik.

Cara menggunakannya:

Terapkan pada grafik 1 atau 5 menit pada instrumen apa pun dengan aktivitas semalam yang signifikan — indeks, forex utama, logam seperti emas dan perak, atau komoditas. Biarkan sesi semalam berjalan hingga 09:30 ET — indikator membangun rentang secara otomatis. Setelah sesi NY dibuka, perhatikan garis Tinggi dan Rendah Globex pada grafik. Sebuah panah kecil menandai bar mana pun di mana sweep level tersebut telah terjadi, mengonfirmasi bahwa likuiditas telah diambil. Mulai saat itu, pantau zona pasokan di atas Tinggi Globex dan zona permintaan di bawah Rendah Globex yang telah diidentifikasi oleh indikator. Cari untuk menjual di zona pasokan setelah sweep Tinggi Globex, dan membeli di zona permintaan setelah sweep Rendah Globex. Gunakan kriteria Anda sendiri untuk manajemen perdagangan. Hindari setup yang terbentuk setelah 13:00 ET karena partisipasi biasanya berkurang.

Profil indikator
Kategori indikator
Struktur pasar (SMC)
Tipe output
Visualisasi
Persyaratan data
Hanya batang
Sinyal yang didukung
Cross
Reversal
Level tertembus
Rentang sesi pembukaan
0.0
Ulasan: 0
Ulasan pelanggan
Belum ada ulasan untuk produk ini. Sudah mencobanya? Jadilah pemberi ulasan pertama!
Market Structure
Produk-produk yang tersedia melalui cTrader Store, termasuk bot trading, indikator, dan plugin, disediakan oleh pengembang pihak ketiga serta hanya ditujukan untuk akses teknis dan informasi. cTrader Store bukan broker dan tidak menyediakan saran investasi, rekomendasi pribadi, atau jaminan apa pun tentang kinerja di masa mendatang.

Produk lain dari penulis ini

Indikator
RSI
Forex
+4
High-probability trading signals in the fast-paced world of forex and CFD trading.
Indikator
Prop
Stocks
+4
High-Performance Renko Chart Indicator with Advanced filtering method - built for Renko and candlestick charts.
Indikator
ATR
MSS
+5
Detects ICT Turtle Soup setups — liquidity sweeps with MSS confirmation, ATR filter & kill zone session filter.
Indikator
SMC
Prop
+15
Automatic Elliott Wave Detection with Professional Filters
Indikator
Fibonacci
Key Levels
DailyTargets: Dynamic ADR-based levels & targets. Includes Buy/Sell zones, previous Hi/Lo, and automated trend alerts.
Indikator
MACD
Key Levels
+2
Trend indicator with multi-timeframe filters, generating signals only on fully completed bricks & candles. No Repaint.
Indikator
Key Levels
Order Block
+3
Marks NY session range, detects wick sweeps beyond box edges.. One signal per day. Overlay, no repainting!
Indikator
EMA
RSI
+2
Advanced TDI indicator with Shark Fin signals, chart arrows, MTF RSI, divergence detection and smart alerts.
Indikator
Key Levels
Supertrend
+3
Marks London and New York session opening zones and alerts you instantly on breakouts.
cBot
EMA
SL Manager
+5
Fully automated dual-symbol hedging cBot for cTrader.
20.6%
ROI
8.66
Faktor laba
Indikator
BOS
Fair Value Gap
+1
ICT Quarterly Theory indicator — color-coded Q1–Q4 session zones with smart entry signals and real-time alerts.
cBot
RSI
Aggressive
automates entries based on the RSX indicator — a smoothed, low-lag variant of the classic RSI.
1.67
Faktor laba

Anda mungkin juga suka

Indikator
ATR
Prop
+6
🟢 Strength-ranked S/R zones with MTF levels and Pro labels. Nearest-zone band and HUD for faster, cleaner entries. 🔴
Indikator
AI
ATR
+27
Overbought Oversold Indicator
Indikator
EMA
Supertrend
+2
Trend Blueprint — All-in-One Trend & Structure
Indikator
Forex
BTCUSD
+10
6-stage IIR filter trend indicator with colored line segments, reversal signals, alerts, and entry arrows.
Indikator
RSI
BTCUSD
+6
Buy/Sell signals filtering noise, color-coded trends & strength shield 🛡️. Trade only with POWER ⚡
Indikator
Prop
Forex
+9
Automatically plots fractal high and low lines on your chart so you always have clean, reliable structure levels.
Indikator
RSI
Forex
+12
Indicator pattern signal moment
Indikator
Prop
Forex
+4
Risk Reward Management Tools(风险回报管理工具)
Indikator
Key Levels
Support & Resistance
Renko Multi-Level Grid Overlay draws configurable horizontal grid lines on any chart type, for multi-timeframe analysis.
Indikator
ATR
BOS
+3
Identifies structure shifts, Supply & Demand zones, and delivers accurate BOS signals for clearer market movement.
Indikator
IVB 2.0 is an indicator that works on the strategy of imbalance of the maximum volatility box of indices
Indikator
Forex
Crypto
+6
The ultimate candlestick suite is here to help you detect most of the candlestick patters that exist today.
Indikator
SMC
Forex
+5
ICT liquidity engine for Gold: maps stop clusters, scores zones & projects the next target. Now with 4 ICT killzones.
Indikator
ATR
BOS
+4
Based on market structure and draws liquidity zones, institutional flows, and consolidation ranges. Smart Money Concepts
Indikator
ATR
Fibonacci
+3
PathoBox non-repainting Fibonacci indicator for accurate support, resistance, entry, and target levels.
Indikator
Prop
Forex
+11
🌊 See when the market is truly in play. Tsunami measures Relative Volume by time-of-day 🌊
Indikator
RSI
MACD
+7
The ZigZag indicator is a technical analysis tool primarily used to identify key price reversal points.
Indikator
Imbalance
AI-assisted
+4
Predict continuity or rejection on range bars. Plots a precise visual box to anticipate candle close price levels.
Sejak 21/02/2025
466.3M
Volume trading
180.83K
Pip dimenangkan
21
Penjualan
6.72K
Instal gratis