
Deskripsi
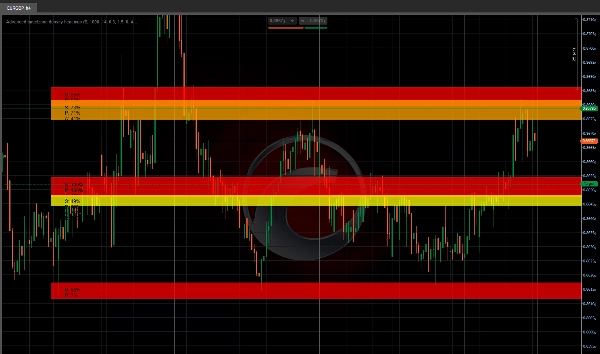
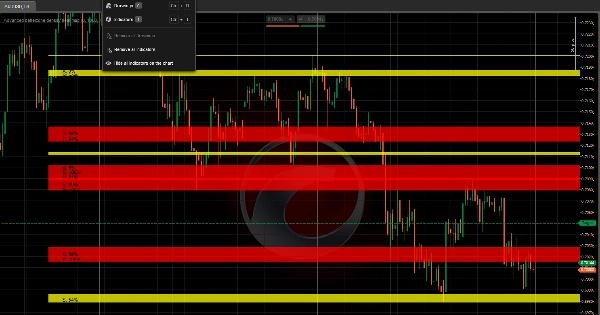
ZONA PANAS STRUKTURAL
Peta Intensitas Partisipasi
--------------------------------------------------
Lihat di mana harga berjuang. Lihat di mana ia mengabaikan.
Sebagian besar alat support/resistance menggambar garis di tempat harga PERNAH berada.
Zona Panas Struktural menjawab: Apakah pasar benar-benar PEDULI dengan level ini?
--------------------------------------------------
SKOR INTENSITAS PANAS (0 sampai 100)
Indikator menganalisis pengelompokan ayunan dan memberikan skor panas:
- Zona merah (80 sampai 100 panas) = Partisipasi struktural terkuat
- Zona oranye (60 sampai 80 panas) = Zona struktural aktif
- Zona kuning (40 sampai 60 panas) = Minat sedang
- Zona biru (di bawah 40 panas) = Struktur lemah
Panas lebih tinggi = lebih banyak ayunan terkumpul = perhatian pasar lebih besar.
--------------------------------------------------
PEMANTAUAN PENERIMAAN VS PENOLAKAN
Untuk setiap zona panas struktural, indikator memantau perilaku harga:
- PENERIMAAN = Harga ditutup di dalam zona (perilaku support)
- PENOLAKAN = Harga meninggalkan ekor panjang di zona (perilaku resistance)
Ini memberi tahu Anda apakah zona kemungkinan akan TAHAN atau BERBALIK.
--------------------------------------------------
ANALISIS KETERLIBATAN PASAR
Sistem mengukur:
- Sentuhan candle (seberapa sering harga mengunjungi setiap zona)
- Penutupan di dalam (tingkat penerimaan)
- Penolakan ekor (tingkat penolakan)
- Periode lookback yang dapat dikonfigurasi
Keterlibatan rendah = zona lemah. Keterlibatan tinggi = zona panas struktural.
--------------------------------------------------
PEMETAAN INTENSITAS VISUAL
- Zona berwarna berdasarkan skor panas (merah = paling panas)
- Perpanjangan halo untuk visualisasi penolakan
- Label data yang menunjukkan: Panas / Partisipasi / Penerimaan / Skor Penolakan
- Pembersihan otomatis (zona digambar ulang secara otomatis)
- Panah swing high/low opsional
--------------------------------------------------
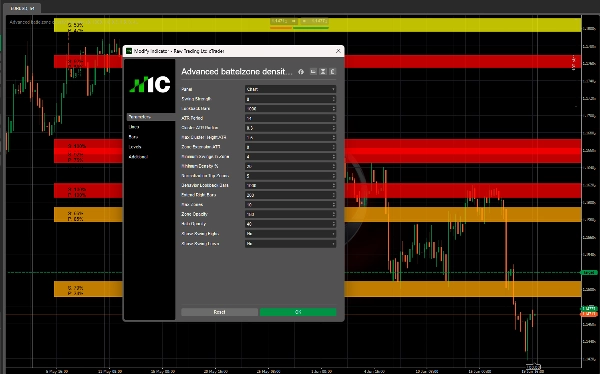
PARAMETER UTAMA
- Kekuatan Swing: Sensitivitas pivot (lebih tinggi = lebih sedikit ayunan)
- Lookback Bars: Seberapa jauh ke belakang untuk mendeteksi ayunan
- Periode ATR: Untuk perhitungan radius adaptif
- Radius Cluster ATR: Seberapa dekat ayunan harus untuk mengelompok
- Tinggi Maksimum Cluster ATR: Menolak zona yang lebih lebar dari ini
- Perpanjangan Zona ATR: Ukuran halo untuk deteksi penolakan
- Minimum Ayunan Dalam Zona: Ukuran minimum klaster
- Skor Panas Minimum: Hanya tampilkan zona di atas ini
- Lookback Bars Perilaku: Periode untuk pelacakan keterlibatan
- Maksimum Zona: Maksimum zona yang ditampilkan
- Opasitas Zona / Halo: Transparansi visual
--------------------------------------------------
KASUS PENGGUNAAN
- Temukan zona panas struktural asli (panas tinggi + keterlibatan tinggi)
- Bedakan zona penerimaan dari zona penolakan
- Hindari area dengan panas rendah dan partisipasi rendah
- Identifikasi klaster struktural untuk penempatan masuk dan keluar
- Konfluensi dengan indikator tren atau aliran order
--------------------------------------------------
CATATAN TEKNIS
- Indikator overlay (digambar di grafik harga)
- Bekerja pada semua kerangka waktu dan simbol
- Otomatis menyesuaikan volatilitas melalui ATR
- Tidak ada repainting (ayunan bersifat historis)
--------------------------------------------------
DARI PEMBUAT INVICTUS EA
Zona Panas Struktural menggunakan teknologi partisipasi struktural yang sama yang ditemukan dalam sistem perdagangan otomatis Invictus.
--------------------------------------------------
PENGUNGKAPAN RISIKO
Indikator ini adalah alat analitis. Ini tidak menghasilkan sinyal perdagangan otomatis. Semua keputusan perdagangan tetap menjadi tanggung jawab pengguna.
--------------------------------------------------
DUKUNGAN
Pembaruan seumur hidup termasuk.
UNTUK INFORMASI LEBIH LANJUT - Klik Profil Pengembang di bawah.
Ringkasan
Key features include color-coded heat zones, halo extensions for rejection visualization, and data labels displaying heat, participation, acceptance, and rejection scores. The system measures candle touches, closes inside zones, and wick rejections over a configurable lookback period to quantify market engagement. Adjustable parameters allow customization of swing sensitivity, cluster radius, zone size, and visual opacity.
This tool supports any timeframe and symbol, adapts to volatility using ATR, and does not repaint historical swings. It is intended for identifying genuine structural heat zones, differentiating acceptance from rejection areas, and aiding entry and exit placement in conjunction with other trend or order flow indicators. The indicator is analytical and does not generate automated trading signals.
Ulasan pelanggan
5 | 100 % | |
4 | 0 % | |
3 | 0 % | |
2 | 0 % | |
1 | 0 % |


