


Description
Le concept principal :
Les mesures classiques de support et de résistance « réaction » : combien de fois le prix a-t-il rebondi ici ? CCZ mesure « acceptation » : combien de temps le prix a-t-il accepté de se négocier ici ?
CCZ effectue une mesure honnête : « Combien de chandeliers consécutifs sans interruption ont accepté ce prix ? »
La méthode :
1. Prenez une tranche de prix récents et découpez-la en fines bandes horizontales, chacune d'environ une fraction de la hauteur actuelle de l'ATR. Considérez-les comme des étagères.
2. Pour chaque bande, parcourez les chandeliers et comptez la plus longue série ininterrompue dont la plage haut-bas croise cette bande. Un chandelier qui manque la bande met fin à la série, et le comptage recommence à zéro.
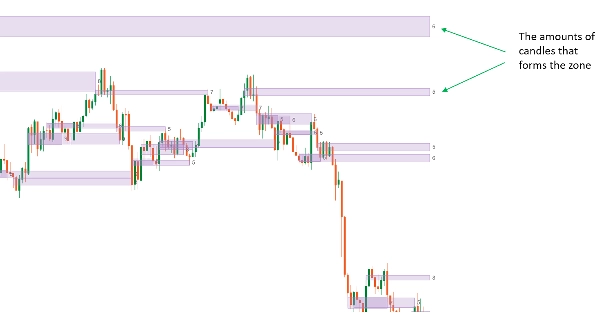
3. Toute bande dont la meilleure série dépasse un seuil — disons six chandeliers (ou défini par les règles de l'utilisateur) — devient une zone.
La règle du « consécutif » est l'idée principale. Un mur de chandeliers consécutifs qui se chevauchent est une consolidation — une étagère de juste valeur.
─────────────────────────────────────
│ │ │ │ │ │ │ │
▓ ▓ ▓ ▓ ▓ ▓ ✗ ▓ ▓
1 2 3 4 5 6 raté 1 2
└── 6 consécutifs ──┘ ↑ └ la série redémarre
qualifie écart
─────────────────────────────────────
Lecture des zones
Chaque zone est un rectangle couvrant une bande de prix, avec un nombre inscrit dessus. Ce nombre est la longueur de la plus longue série ininterrompue de chandeliers qui ont tous touché la bande — le score de force de la zone. Un « 6 » signifie que six chandeliers consécutifs ont partagé ce prix ; un « 12 » est un niveau beaucoup plus contesté qu’un « 6 ».
Le bord droit d’une zone s’étend vers l’avant tant qu’elle reste pertinente. Une fois que le prix s’en est éloigné puis est revenu, la zone est **atténuée** — elle a été testée et cesse de s’étendre. Vous choisissez ce que signifie « revenir » :
- « Toucher » — toute mèche revenant dans la zone l’atténue (strict)
- « Clôturer à l’intérieur » — seul un chandelier clôturant à l’intérieur compte (souple)
- « Toucher puis clôturer à l’intérieur » — une mèche d’abord, puis un chandelier ultérieur clôturant à l’intérieur — ignore les rejets à mèche unique
Une option pour cacher les zones une fois atténuées permet de ne garder sur le graphique que les niveaux encore en jeu.
Détection de zone sur n’importe quelle unité de temps de base
Les chandeliers comptés ne doivent pas forcément être ceux de votre graphique. Définissez une unité de temps de base une fois pour toutes — inférieure, égale ou supérieure à celle de votre graphique — et les zones sont construites à partir des chandeliers de cette unité de temps, quel que soit le graphique sur lequel vous les visualisez.
Exécutez-le sur des chandeliers H1 tout en tradant depuis un graphique M5, et les mêmes zones construites en H1 apparaissent sur les deux graphiques. Zoomez sur M1 et ce sont toujours les mêmes niveaux — vous regardez une vue agrandie d’une seule détection, pas une différente par unité de temps.
Paramètres
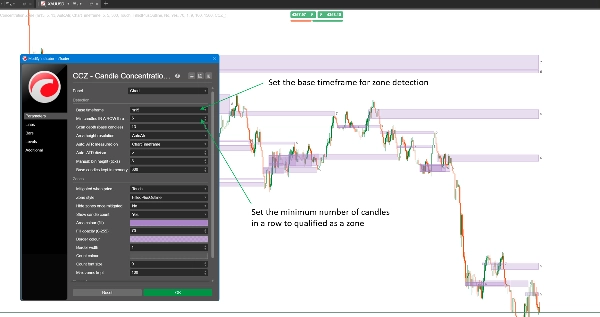
- Unité de temps de base — indépendante du graphique, n’importe quelle résolution
- Nombre minimum de chandeliers consécutifs requis pour qualifier une zone
- Profondeur de balayage — combien de chandeliers de base la fenêtre glissante couvre
- Résolution de la hauteur de la zone : Auto (basée sur l’ATR) ou Manuel (ticks fixes)
- Mode auto : mesurer l’ATR sur l’unité de temps du graphique ou sur celle de base, plus un diviseur ATR pour définir à quel point une bande compte comme « le même niveau »
- Chandeliers de base conservés en mémoire
- Règle d’atténuation : Toucher / Clôturer à l’intérieur / Toucher puis clôturer à l’intérieur
- Style de zone : contour seul, ou rempli + contour, avec opacité de remplissage indépendante
- Cacher les zones une fois atténuées
- Étiquette de comptage des chandeliers : activée/désactivée, couleur, taille de police
- Couleur et largeur de la bordure, nombre maximum de zones conservées, barres du graphique analysées au chargement
Utilisation typique
Utilisez-le comme un second avis objectif sur vos propres supports et résistances — un niveau n’apparaît que parce que les chandeliers ont prouvé à plusieurs reprises qu’il était important, pas parce qu’il semble important sur le graphique.
Exécutez l’unité de temps de base plus haute que votre graphique d’entrée pour trader à partir d’étagères propres de plus hautes unités de temps sans changer de fenêtre pour les trouver. Ou égalisez-la à votre unité de temps de graphique pour une lecture pure de l’action des prix où la session actuelle est continuellement rejetée.
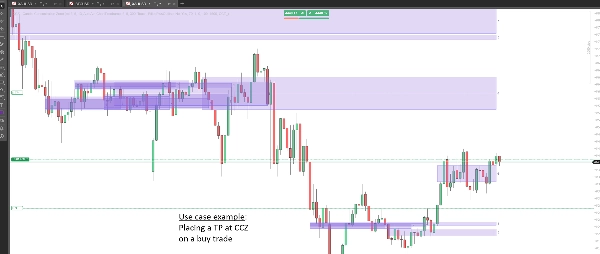
Il se combine naturellement avec un déclencheur d’entrée séparé : utilisez les zones comme votre biais pour où chercher un retournement ou une cassure, et votre propre signal pour quand agir. Parfois, vous pouvez aussi les lire comme une zone cible.
Pour qui c’est
Les traders qui pensent déjà en termes de support, résistance, ou zones d’offre et de demande, et qui veulent une méthode basée sur des règles pour trouver les zones fortes au lieu de deviner les sommets et creux. Utile des unités de temps de scalping jusqu’au swing trading, sur forex, indices, métaux ou crypto. Il suppose que vous avez déjà une méthode pour décider des entrées — cet outil trouve les niveaux, pas le déclencheur.
Ce qu’il ne fait pas
- Il ne donne aucun signal d’achat ou de vente, ni prix d’entrée, stop ou cible
- Il ne passe aucune ordre et ne peut pas accéder à votre compte — l’indicateur fonctionne sans aucun droit d’accès
- Il n’a pas d’alertes ni de notifications
- Il ne repeint pas l’historique : seuls les chandeliers fermés sont comptés, et le score de force d’une zone ne change jamais après coup. Son bord droit continue de s’étendre à chaque barre jusqu’à ce que la zone soit atténuée — c’est la zone qui reste active, pas le passé qui est redessiné
Choses à savoir
Si vous définissez l’unité de temps de base plus haute que celle de votre graphique, changez aussi « ATR mesuré sur » pour la base. La laisser sur l’unité de temps du graphique mesure un chandelier de plus haute unité de temps avec une règle plus petite, ce qui rend la bande de prix beaucoup trop fine et les zones beaucoup trop rares pour se former.
Une zone ne peut être jugée atténuée qu’après que le prix l’a d’abord quittée puis y est revenu — une zone encore en formation ne peut pas être atténuée sur son premier chandelier.
Les chandeliers de base de plus haute unité de temps commencent à l’heure du serveur de votre courtier. Deux courtiers peuvent légitimement découper le même chandelier de plus haute unité de temps à des moments différents, donc les zones sur le même symbole peuvent être légèrement différentes selon les courtiers. C’est une propriété des données, pas un défaut de l’indicateur.
Le trading comporte des risques. Les performances passées ne garantissent pas les résultats futurs.
Résumé
Key features include:
- Detection of zones from any user-defined base timeframe, independent of the chart timeframe, allowing higher timeframe zones to be viewed on lower timeframe charts.
- Zones are displayed as rectangles with a strength score indicating the longest consecutive candle count overlapping the zone.
- Mitigation rules determine when a zone is considered tested and no longer extends forward, with options for strict or lenient definitions based on candle touches or closes.
- Customizable settings such as minimum candles in a row, scan depth, band height resolution, zone style, and label display.
- Designed for traders who use support, resistance, or supply and demand concepts and want an objective, rule-based method to identify strong levels.
- Supports markets including forex, indices, metals, and crypto across scalping to swing trading timeframes.
- The indicator does not provide trade signals, alerts, or order execution capabilities and does not repaint historical data.
CCZ serves as a tool to objectively highlight price consolidation zones that can be used as bias areas for potential reversals or breakouts.
Avis clients
Discussion
Questions fréquentes
Plus de cet auteur


















Prix