


Description
What it does
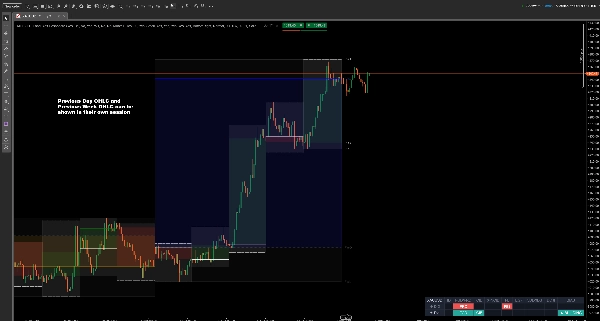
MULTI-TIMEFRAME OHLC and BIAS DASHBOARD is a multi-timeframe price action indicator for cTrader. It draws the previous day, previous week and previous month OHLC levels — open, high, low and close — onto your chart, and adds a dashboard that reads what price actually did at those levels over the last two completed days.
Previous day high and low (PDH and PDL), the daily open, the weekly high and low: these are the higher timeframe support and resistance levels most intraday and swing traders already work from. What they usually do by eye every morning is compare them — did yesterday close above the day before? Did price poke through the previous day high and fail? Is the move building or running out of room? This indicator answers those questions on the chart, in one row.
Multi-timeframe OHLC levels
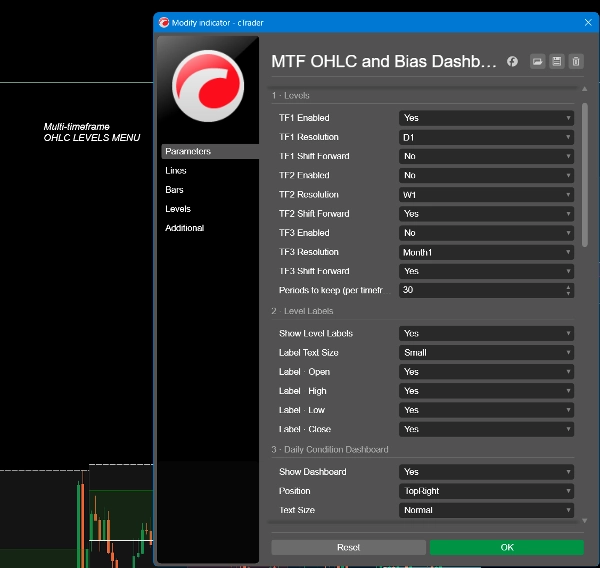
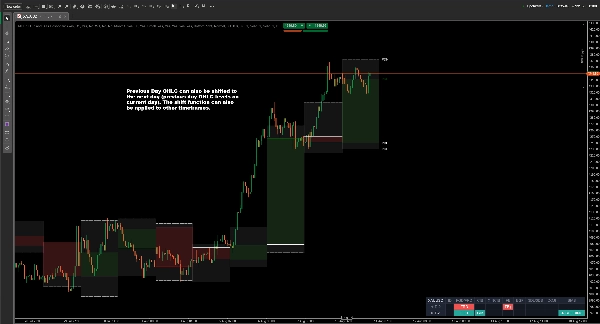
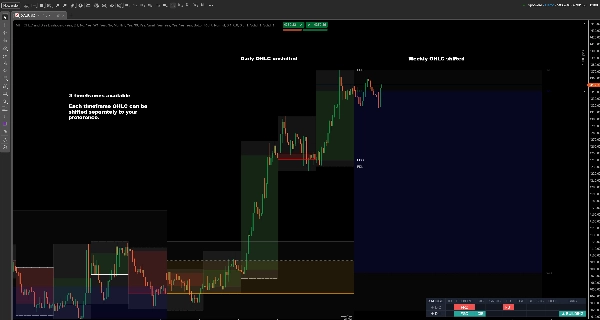
Up to three timeframes at once — daily, weekly, monthly, or any resolution you choose. Each draws its open, high, low and close, with an optional shaded body and a high-to-low band. Levels can be shifted forward so the current period's reference sits ahead of price rather than behind it, and you can keep up to 70 historical periods on the chart.
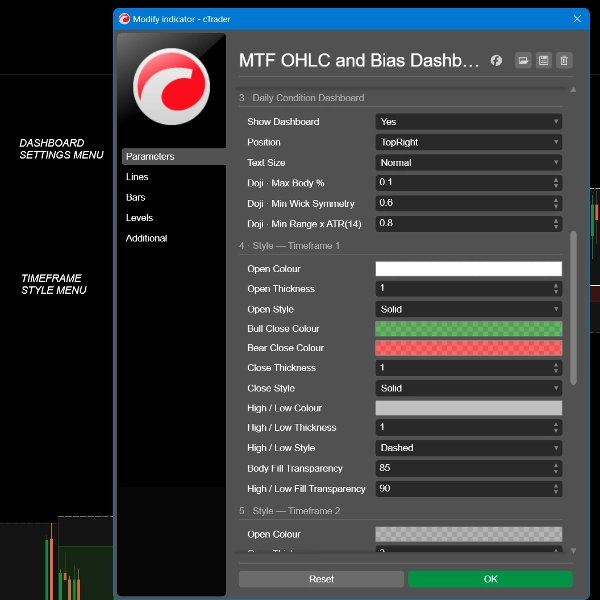
Every line has its own colour, thickness and style, so a weekly support level never gets confused with a daily one.
The daily condition dashboard
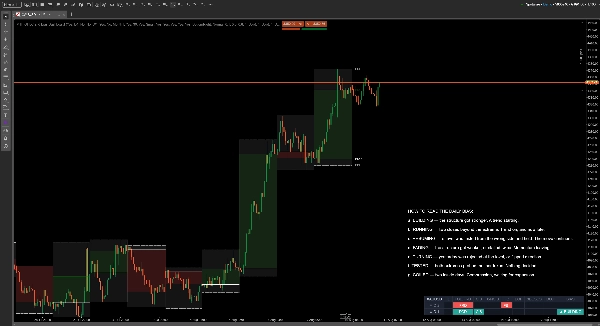
The dashboard grades the last two completed daily candles — D-1 (yesterday) and D-2 (the day before) — each against the day that preceded it.
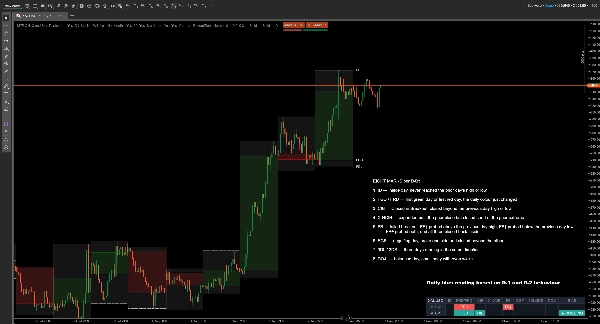
Nine marks per day:
- ID — inside day, never reached the prior day's high or low
- FGD / FRD — first green day or first red day, the daily colour just changed (Green is bull day and Red is bear day)
- CIB — Closed in Breakout, closed beyond the previous day high or low
- X-NCIB — expanded past the prior close but closed short of the prior extreme (Expand Not Closed In Breakout = X-NCIB)
- FB — failed breakout: FB↑ probed above the previous day high, FB↓ probed below the previous day low, FB± probed both, and all three closed back inside
- EGF — engulfing day, broke one side and closed beyond the other
- 3DL / 3DS — three days running in the same direction (3 Days of Long = 3DL/ 3 Days of Short = 3DS)
- DOJI — balanced day, small body with even wicks
- BIAS — the reading, explained below
How to read the daily bias
The bias is the part that saves you the work. Each day collapses to a single state, and the bias comes from the movement between D-2 and D-1 — not from yesterday alone. The same mark means different things depending on what preceded it, and that is exactly what a single-day dashboard cannot tell you.
- BUILDING — the structure got stronger. A trend starting.
- RUNNING — two closes beyond the extreme. Trend on, and now late.
- RESUMING — a level was tested from the wrong side and held. The move continues.
- FADING — the structure got weaker, or stalled twice. Momentum leaving.
- TURNING — yesterday was rejected at the level, or flipped direction.
- TESTED — both extremes probed, neither taken. Nothing decided.
- COILED — two inside days. Compression, waiting for expansion.
An arrow and colour carry the direction: green up for bullish, red down for bearish, neutral grey when there is no direction to give.
Both detail rows stay visible above the bias, so you can always see why it reads the way it does rather than trusting a black box.
Typical use
Open the chart in the morning, read the bias, and know before the session starts whether you are looking for continuation, a fade, or a range. Then trade your own setups against the drawn levels — the previous day high and low, the daily open, the weekly extremes.
It suits opening-range work, failed-breakout trading, and day-to-day continuation strategies. Useful across forex, indices, metals and crypto.
Settings
- Three independent timeframe slots, each with its own resolution, shift-forward toggle and full colour, thickness and style controls
- Number of historical periods to keep, up to 70
- Level labels on or off, per line type, with adjustable text size
- Dashboard on or off, five screen positions, four text sizes
- Doji sensitivity: maximum body percentage, minimum wick symmetry, minimum range relative to the 14-day average
******************************************************
Who it's for
Intraday and swing traders who already work from previous day and previous week levels. It assumes you know what a previous day high is and why it matters. If those levels are not already part of how you trade, this will not teach you to use them.
What it does not do
Being clear about this now saves us both time later:
- It gives no buy or sell signals, and no entry or exit prices
- It places no orders and cannot touch your account — the indicator runs with no access rights at all
- It has no alerts or notifications
- It predicts nothing. Every mark describes candles that have already closed
- It does not repaint. The dashboard reads only completed daily candles, so a reading never changes after the fact
- It is not a strategy. The bias describes structure; it does not recommend a trade
********************************************************
Things worth knowing
The dashboard needs at least four completed daily candles, so a newly listed symbol will show dashes until it has enough history.
Daily candles start at your broker's server time. Two brokers on the same instrument can cut the day at different hours, which means the same symbol can legitimately read differently on two platforms. That is a property of the data, not a fault in the indicator.
Above the daily timeframe the dashboard cannot read daily data and shows a TF > D warning. The levels still draw.
Trading involves risk. Past performance does not guarantee future results.
Summary
A central feature is the two-day price action bias dashboard, which analyzes the last two completed daily candles relative to their preceding days. It categorizes daily price behavior into nine distinct patterns (e.g., inside day, first green/red day, failed breakout, engulfing day) and summarizes the overall bias into states such as building, running, fading, or turning. Directional bias is indicated with colored arrows (green for bullish, red for bearish, grey for neutral), helping traders quickly assess market structure without guesswork.
Designed for intraday and swing traders familiar with previous day and week levels, the indicator does not provide trade signals, alerts, or order execution. It is suitable for forex, indices, metals, and cryptocurrencies, aiding strategies like opening-range, failed-breakout, and continuation trading by clearly marking key levels and daily price action context.
Discussion
Customer reviews
FAQ
More from this author




















Price