


Deskripsi
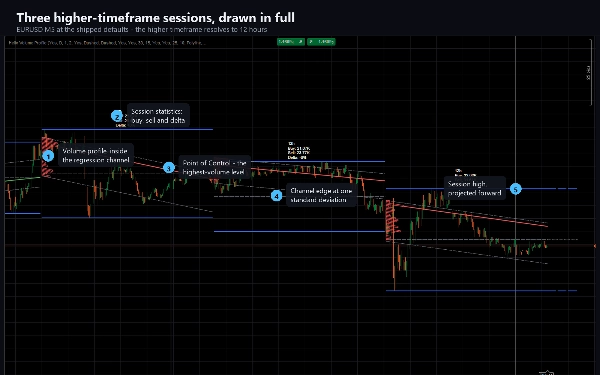
Helix Volume Profile membangun gambaran lengkap dari sesi kerangka waktu yang lebih tinggi tempat grafik saat ini berada di dalamnya.
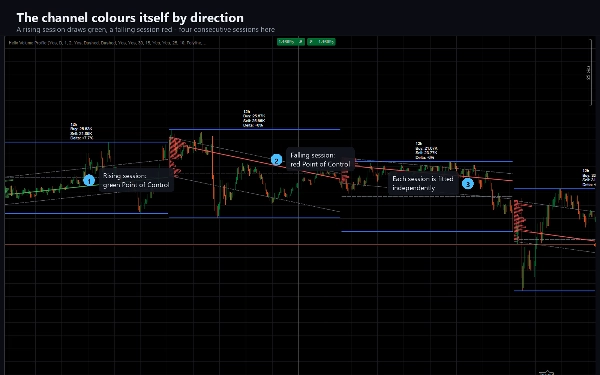
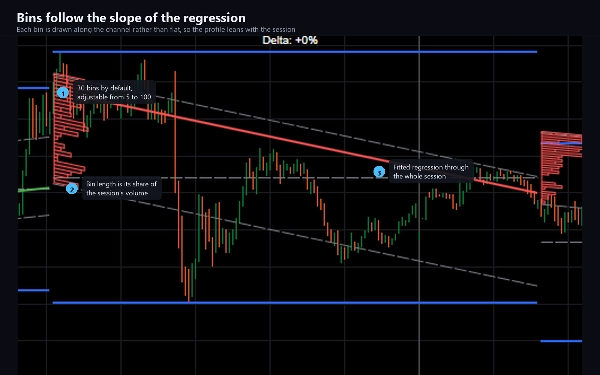
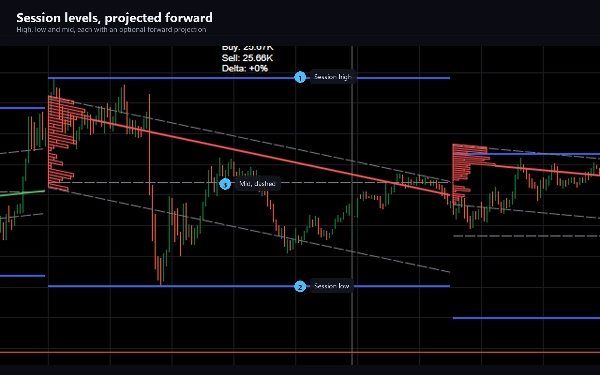
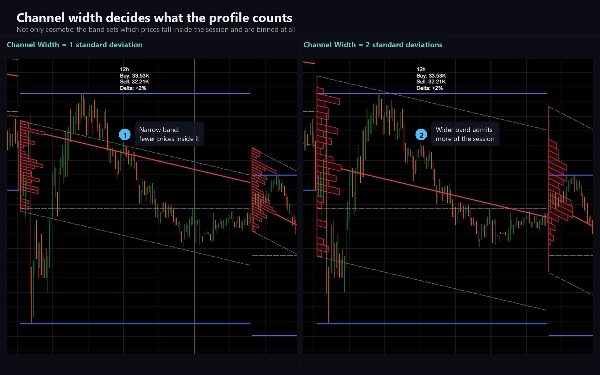
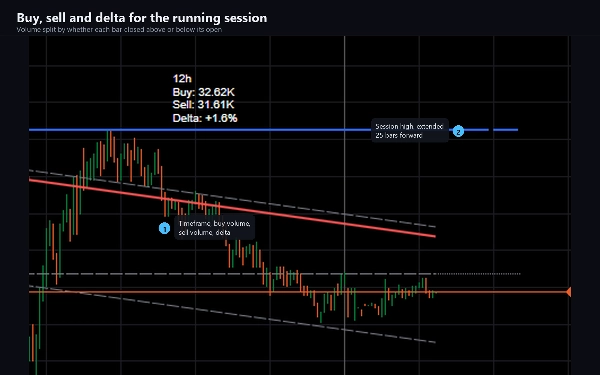
Untuk setiap sesi, ia memasang regresi logaritmik di setiap bar sejauh ini, menggambar saluran dengan lebar sejumlah deviasi standar yang dapat dikonfigurasi di sekitarnya, dan mengisi saluran tersebut dengan profil volume yang bin-nya mengikuti kemiringan regresi daripada duduk datar. Bin volume tertinggi ditandai dengan garis Titik Kontrol, yang diberi warna sesuai arah pergerakan saluran. Level tertinggi, terendah, dan tengah sesi digambar di sampingnya dan dapat diproyeksikan ke depan, serta label ringkas melaporkan volume beli, volume jual, dan delta di antara keduanya.
Kerangka waktu yang lebih tinggi dipilih secara default untuk Anda dan menyesuaikan dengan grafik: sesi 12 jam pada M5, empat jam pada M1, dua hari pada M15, satu minggu pada H1, satu bulan pada H4. Anda dapat mematikannya dan mengatur sesi sendiri - menit, hari, minggu, atau bulan semuanya diterima.
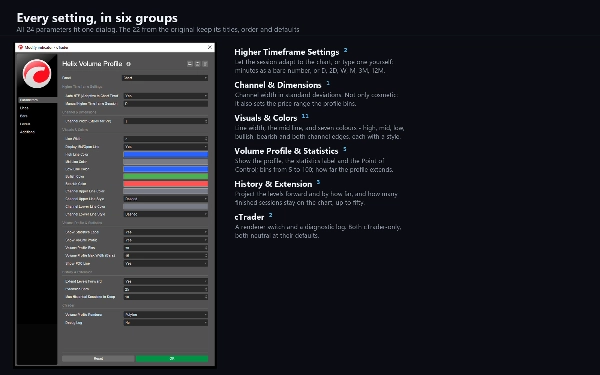
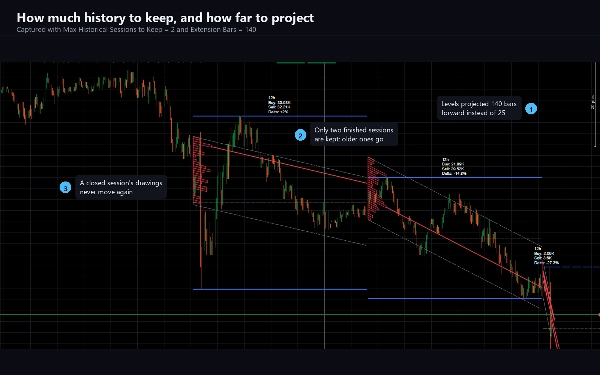
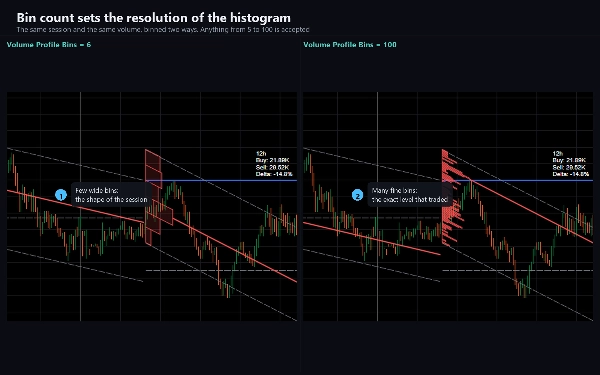
Semua dapat disesuaikan. Lebar saluran, jumlah bin profil dari 5 hingga 100, sejauh mana profil meluas, apakah Titik Kontrol, label statistik, dan proyeksi ke depan ditampilkan, lebar dan gaya garis, tujuh warna, dan berapa banyak sesi yang selesai tetap berada di grafik, hingga lima puluh.
UNTUK APA INI
Membaca posisi harga di dalam struktur kerangka waktu yang lebih tinggi tanpa meninggalkan kerangka waktu kerja Anda. Saluran menunjukkan pergeseran dan dispersi sesi; profil menunjukkan di mana volume sebenarnya terkumpul di dalamnya; Titik Kontrol menandai level yang melihat aktivitas paling banyak. Trader menggunakan ini untuk membingkai support dan resistance, menilai apakah pergerakan terlalu jauh relatif terhadap sesi, dan melihat apakah pembelian atau penjualan yang mendominasi.
Cocok untuk instrumen dan kerangka waktu apa pun. Ini paling informatif pada grafik intraday dari M1 hingga H4, di mana sesi adaptif memberikan jendela yang bermakna; pada Daily dan lebih tinggi, atur sesi secara manual.
BAGAIMANA PERILAKUNYA
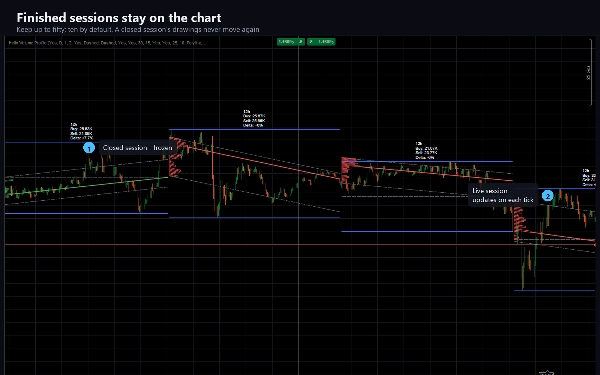
Sesi langsung diperbarui pada setiap tick dan gambarnya bergerak sampai sesi ditutup - saluran dipasang ulang, profil dibangun kembali, dan level diukur ulang saat setiap bar tiba. Setelah sesi berakhir, gambarnya dibekukan dan tidak pernah berubah lagi. Ini disengaja dan itulah cara metode ini bekerja; jika Anda membutuhkan level yang tidak pernah bergerak intrabar, baca sesi yang sudah ditutup daripada sesi langsung.
Volume pada simbol forex adalah jumlah tick yang dilaporkan broker Anda, sehingga profil mencerminkan feed Anda sendiri.
TEKNIS
Indikator, overlay. 24 parameter. Tidak ada izin trading, tidak ada akses file dan tidak ada akses jaringan - dibangun dengan AccessRights disetel ke None dan tidak dapat melakukan order. Termasuk edisi percobaan yang dibatasi pada EURUSD tanpa batas waktu dan tanpa fitur yang dinonaktifkan.
Dokumentasi mencakup instalasi, setiap parameter dengan tujuannya, dan panduan pemecahan masalah yang menjelaskan setiap perilaku yang mengejutkan orang.
Trading melibatkan risiko. Kinerja masa lalu tidak menjamin hasil di masa depan.
Ringkasan
The higher timeframe session adapts automatically based on the chart timeframe (e.g., 12 hours on M5, one week on H1) but can be manually set to minutes, days, weeks, or months. Users can customize channel width, number of volume bins (5 to 100), profile extension, visibility of elements, colors, line styles, and how many past sessions remain visible (up to 50).
The live session updates on every tick, recalculating the channel and volume profile until session close, after which the data is fixed. Volume data reflects the broker's tick count for forex symbols. Helix Volume Profile is suitable for any instrument and timeframe, with particular utility on intraday charts from M1 to H4. It includes 24 adjustable parameters and operates without trading permissions or network access.
Diskusi
Ulasan pelanggan
5 | 0 % | |
4 | 100 % | |
3 | 0 % | |
2 | 0 % | |
1 | 0 % |















![Logo "High-Low Divergence [Iridio Capital]"](https://cdn.ctrader.com/image/webp/10a9e91b-243a-43f6-bbfe-7376bad5a214_61554)





![Logo "[Hamster-Coder] Moving Average MTF"](https://cdn.ctrader.com/image/webp/b11b98b1-194d-4b8e-b00e-d611826ad159_31226)





