
Deskripsi
Ketahui dengan tepat kapan pasar utama buka dan tutup. FX Market Sessions menampilkan empat sesi perdagangan utama dengan level tertinggi dan terendah mereka, membantu Anda menentukan waktu masuk di sekitar jam paling volatil dalam sehari.
Fitur Utama
- Empat Sesi Utama: Sesi Sydney, Tokyo, London, dan New York ditampilkan dengan waktu mulai/akhir yang dapat disesuaikan dan penyesuaian DST otomatis
- Level Tertinggi/Rendah Sesi: Secara otomatis melacak dan menampilkan level tertinggi dan terendah setiap sesi dengan garis yang dapat diperpanjang untuk perencanaan support/resistance
- Tampilan Sesi Langsung: Panel info waktu nyata menunjukkan sesi mana yang sedang buka - tidak perlu lagi menebak kapan London atau New York dimulai
- Konteks Historis: Lihat hingga 10 hari level sesi sebelumnya untuk melihat bagaimana harga bereaksi pada batas sesi utama
- Kustomisasi Penuh: Pilih sesi mana yang akan ditampilkan, pilih warna kustom, dan tentukan apakah level tertinggi/rendah diperpanjang tanpa batas
Cara Kerja
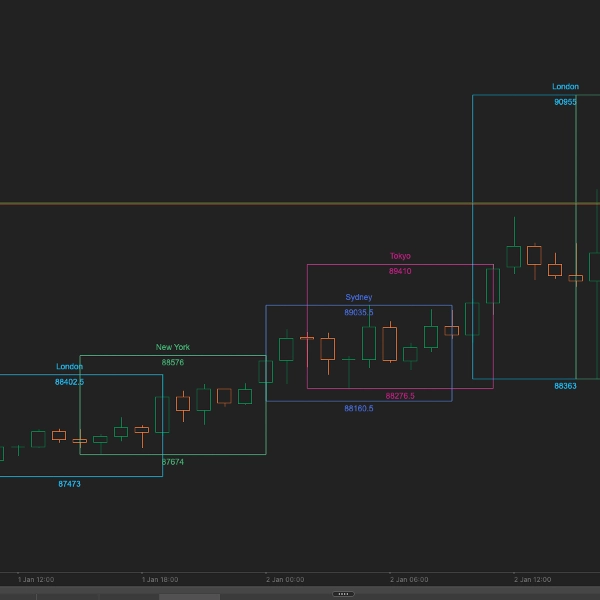
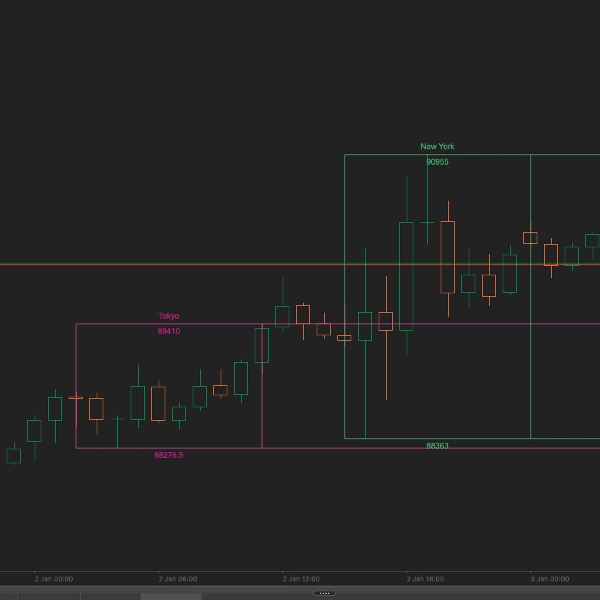
Indikator secara otomatis menghitung empat sesi perdagangan forex utama berdasarkan zona waktu lokal masing-masing:
- Sydney: 21:00-06:00 AEST (menyesuaikan untuk DST)
- Tokyo: 00:00-09:00 JST
- London: 08:00-17:00 GMT (menyesuaikan untuk DST)
- New York: 13:00-22:00 EST (menyesuaikan untuk DST)
Setiap sesi digambar sebagai zona vertikal dengan level tertinggi dan terendah yang ditandai. Panel info di sudut kanan atas menampilkan sesi mana yang sedang buka secara waktu nyata.
Parameter
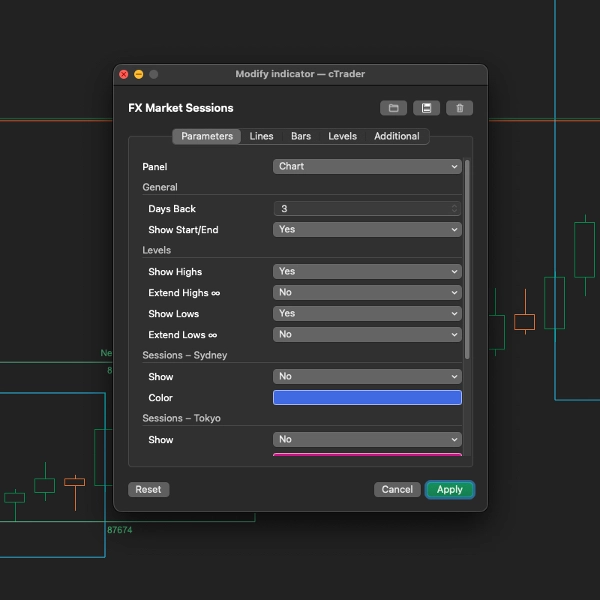
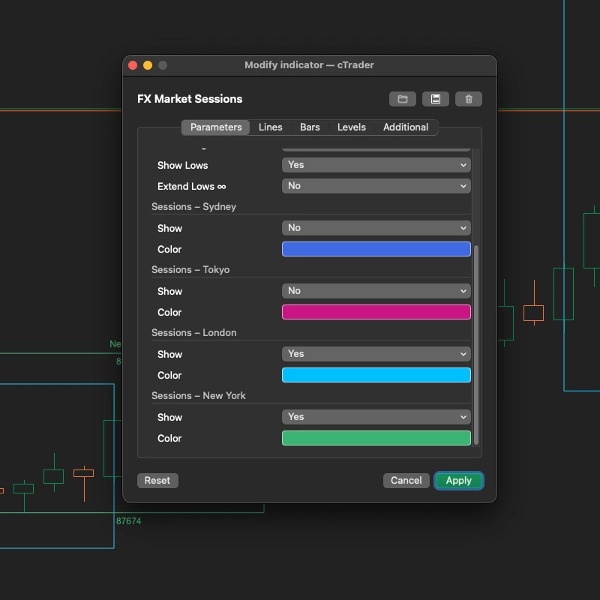
Pengaturan Umum
- Hari Kembali (Default: 3): Jumlah hari historis untuk menampilkan kotak sesi (0-10)
- Tampilkan Mulai/Akhir (Default: True): Menggambar garis vertikal pada waktu buka dan tutup sesi
Pengaturan Level
- Tampilkan Tertinggi (Default: True): Menampilkan level tertinggi setiap sesi
- Perpanjang Tertinggi (Default: False): Memperpanjang garis tertinggi ke tepi kanan grafik
- Tampilkan Terendah (Default: True): Menampilkan level terendah setiap sesi
- Perpanjang Terendah (Default: False): Memperpanjang garis terendah ke tepi kanan grafik
Pengaturan Sesi (Sydney, Tokyo, London, New York)
- Tampilkan: Aktifkan atau nonaktifkan sesi individu
- Warna: Warna kustom untuk elemen tampilan setiap sesi
Ideal Untuk
- Trader harian yang perlu mengetahui kapan volatilitas meningkat
- Trader breakout yang berdagang saat sesi dibuka
- Trader yang menggunakan level tertinggi/terendah sesi sebagai support/resistance
- Siapa saja yang ingin memvisualisasikan jam perdagangan terbaik
Tips Perdagangan
- Pembukaan London: Salah satu periode paling volatil - sering menentukan arah hari itu
- Tumpang Tindih London/New York: 13:00-16:00 GMT biasanya memiliki volume dan volatilitas tertinggi
- Sesi Asia: Terbaik untuk memperdagangkan pasangan JPY dan pasangan AUD
- Breakout Sesi: Harga yang menembus di atas/bawah level tertinggi/terendah sesi dapat menandakan pergerakan lanjutan
Timeframe yang Didukung
Bekerja optimal pada timeframe dari M5 hingga H4. Indikator secara otomatis menyesuaikan kotak sesi agar sesuai dengan skala grafik Anda.
Ringkasan
Key features include automatic plotting of session high and low price levels, with options to extend these levels across the chart for support and resistance analysis. A live info panel shows which sessions are currently open in real-time. Users can customize which sessions to display, adjust colors, and set how many past days (up to 10) of session data to show, excluding weekends.
The indicator is optimized for intraday timeframes, working best on 5-minute to 4-hour charts. It provides historical context by showing previous session levels, aiding traders in timing entries around periods of increased volatility such as the London open and the London/New York overlap. This tool supports trading strategies that rely on session timing and price levels for breakout and intraday trading decisions.
Ulasan pelanggan
5 | 100 % | |
4 | 0 % | |
3 | 0 % | |
2 | 0 % | |
1 | 0 % |


