
Descrizione
Domina il mercato con la lettura del flusso istituzionale.
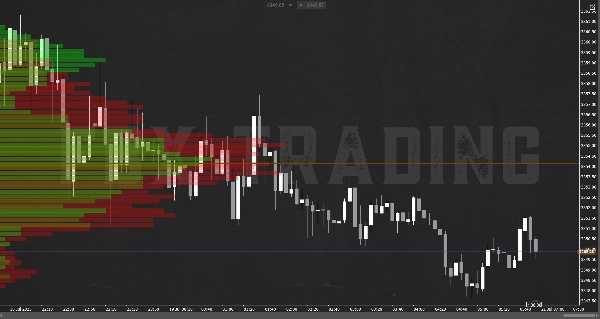
Il FBX_VPVR_Sobreposto è un indicatore avanzato di Volume Profile Visibile con sovrapposizione intelligente di acquisto e vendita, progettato per trader esigenti che cercano precisione tecnica e vantaggio competitivo.
✔️ Calcola e visualizza automaticamente i livelli essenziali:
• POC (Point of Control) – punto di maggior volume scambiato
• VAL e VAH (Area di Valore) – zone dove si concentra il 70% delle negoziazioni
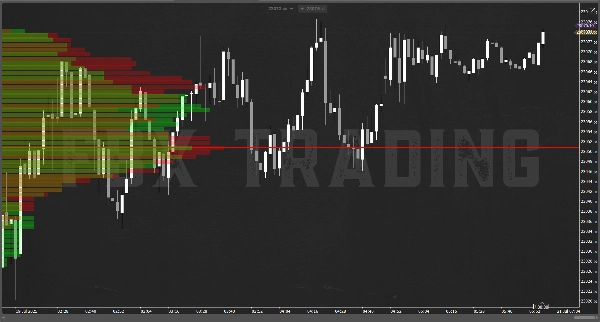
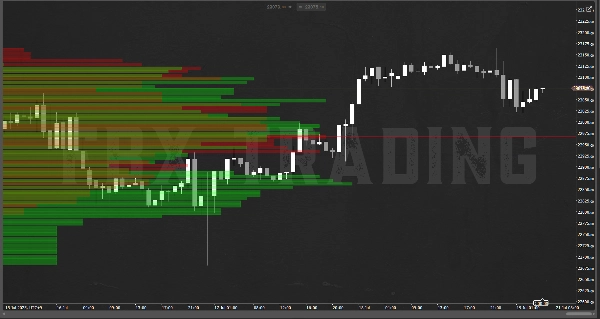
• Distribuzione dinamica del volume di acquisto e vendita con visualizzazione intuitiva
🎯 Compatibile con tutti i timeframe (M1 a D1), con aggiornamento in tempo reale mentre navighi nel grafico. Ideale per scalping, day trade e analisi istituzionale, senza inquinamento visivo.
🔍 Identifica zone di difesa, trappole di liquidità e regioni dominate da grandi operatori – tutto con chiarezza, fluidità e lettura in tempo reale.
💡 Sviluppato nel contesto del progetto FBX Trading, basato su setup professionali e raffinato in ambiente di operazioni reali.
Semplice. Veloce. Potente.
Prova la visione che la maggior parte dei trader non ha.
Riepilogo
Recensioni dei clienti
5 | 100 % | |
4 | 0 % | |
3 | 0 % | |
2 | 0 % | |
1 | 0 % |