Precio Promedio Ponderado por Volumen
Indicatore
250 download
Versione 1.0, Jul 2025
Windows, Mac
Descrizione
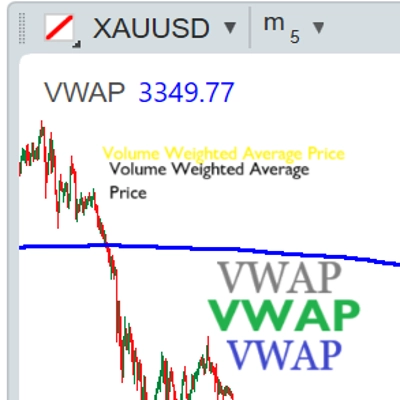
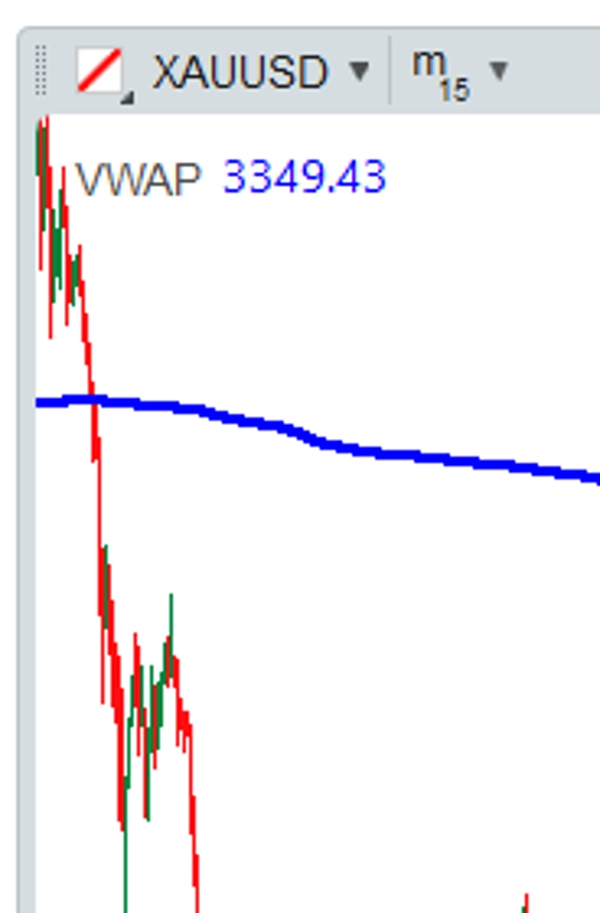
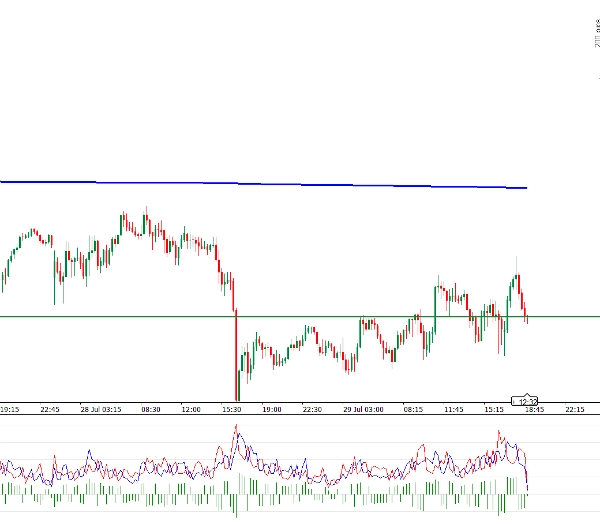
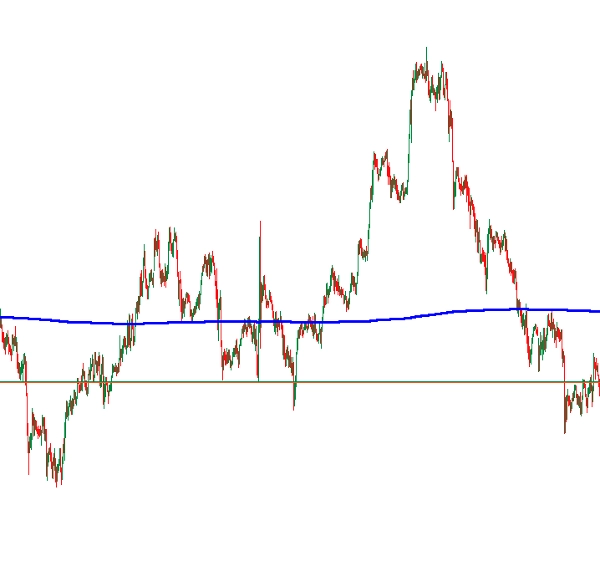
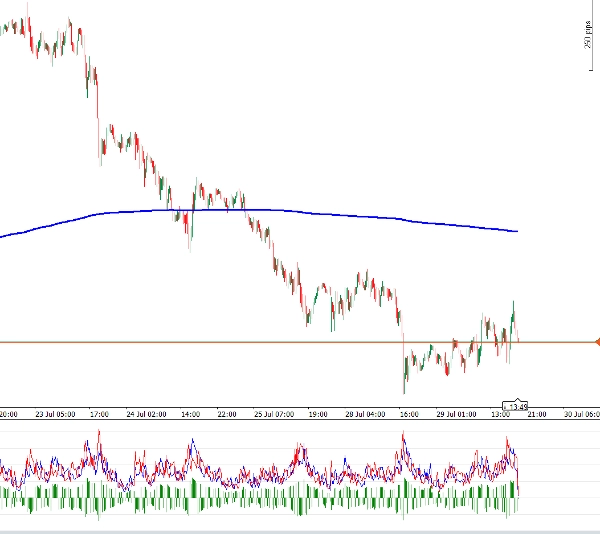
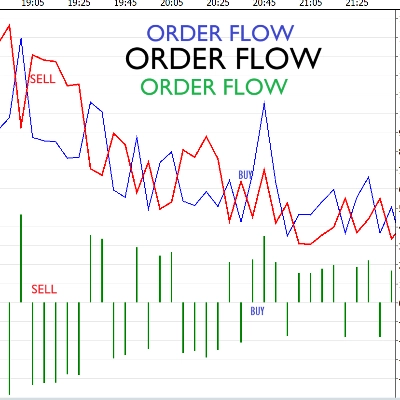
Il VWAP è un indicatore tecnico che calcola il prezzo medio di un asset ponderato per il suo volume, utile per identificare tendenze, livelli di supporto/resistenza e punti di ingresso/uscita.
Regole di ingresso
- Acquisto (Posizione Long):
-
- Il prezzo attraversa verso l'alto il VWAP e chiude una candela sopra.
- Vendita (Posizione Short):
-
- Il prezzo attraversa verso il basso il VWAP e chiude una candela sotto.
Riepilogo
Riepilogo AI
The Precio Promedio Ponderado por Volumen (VWAP) indicator calculates the volume-weighted average price of an asset. It helps identify market trends, support and resistance levels, and potential entry and exit points. The indicator signals a long (buy) position when the price crosses above the VWAP and closes a candle above it. Conversely, it signals a short (sell) position when the price crosses below the VWAP and closes a candle below it. This tool is used for technical analysis to support trading decisions based on price and volume dynamics.
Profilo indicatore
Recensioni dei clienti
0.0
Recensioni: 0
Recensioni dei clienti
Questo prodotto non ha ancora ricevuto recensioni. L'hai già provato? Fallo sapere agli altri per primo!
Discussioni
Domande frequenti
I prodotti disponibili tramite cTrader Store, inclusi bot di trading, indicatori e plugin, sono forniti da sviluppatori terzi e resi disponibili esclusivamente a scopo informativo e di accesso tecnico. cTrader Store non è un broker e non fornisce consulenze in materia di investimento, raccomandazioni individualizzate o garanzie di risultati futuri.
Altro da questo autore


Prezzo
412.95K
Volume negoziato
24.92K
Profitto in pip
6
Vendite
647
Installazioni gratuite