
Descrizione
Ultimate RSI (Indice di Forza Relativa)
L'Ultimate RSI è un oscillatore avanzato e personalizzato progettato per fornire una lettura più fluida, pulita e reattiva del momento di mercato e della forza del trend. Rappresenta un significativo miglioramento rispetto al tradizionale Indice di Forza Relativa (RSI), concentrandosi sull'eliminazione del rumore di mercato e sulla minimizzazione dei falsi segnali (whipsaw). Questo lo rende uno strumento prezioso per confermare i trend e individuare punti di svolta affidabili.
Caratteristiche principali e miglioramenti:
- Calcolo del momento potenziato: L'indicatore utilizza un metodo sofisticato per calcolare la variazione di prezzo. Invece di basarsi esclusivamente sui movimenti di prezzo giornalieri, il segnale di momentum è notevolmente rafforzato quando il prezzo registra un nuovo massimo o un nuovo minimo nel periodo di osservazione. Questo processo garantisce che l'indicatore reagisca con forza a rotture genuine ignorando movimenti minori e irregolari.
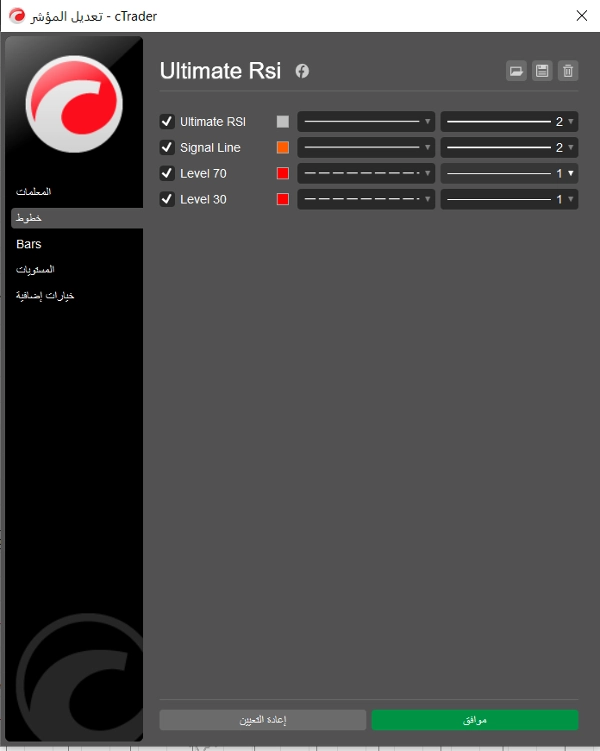
- Linea di segnale dedicata: Include una distinta Linea di Segnale (una media mobile dello stesso RSI) che può essere configurata indipendentemente. Gli incroci tra la linea Ultimate RSI e la sua Linea di Segnale sono spesso utilizzati come segnali più chiari e con maggiore affidabilità per ingressi o uscite, specialmente vicino ai livelli di ipercomprato/ipervenduto.
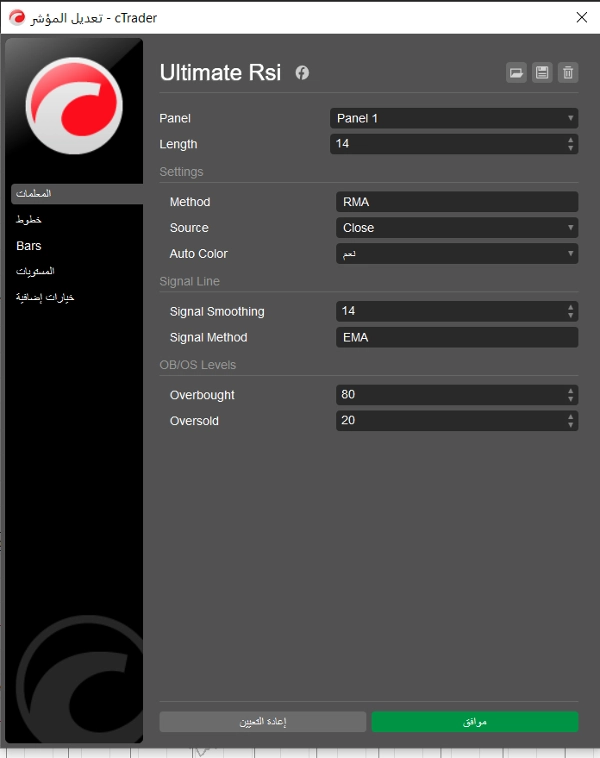
- Metodi di smussatura flessibili: Gli utenti hanno la flessibilità di selezionare il tipo di smussatura sia per il calcolo dell'RSI che per la Linea di Segnale tra opzioni comuni: EMA (Media Mobile Esponenziale), SMA (Media Mobile Semplice), RMA (Media Mobile di Wilder) e TMA (Media Mobile Triangolare). Questo permette una personalizzazione precisa della sensibilità dell'indicatore.
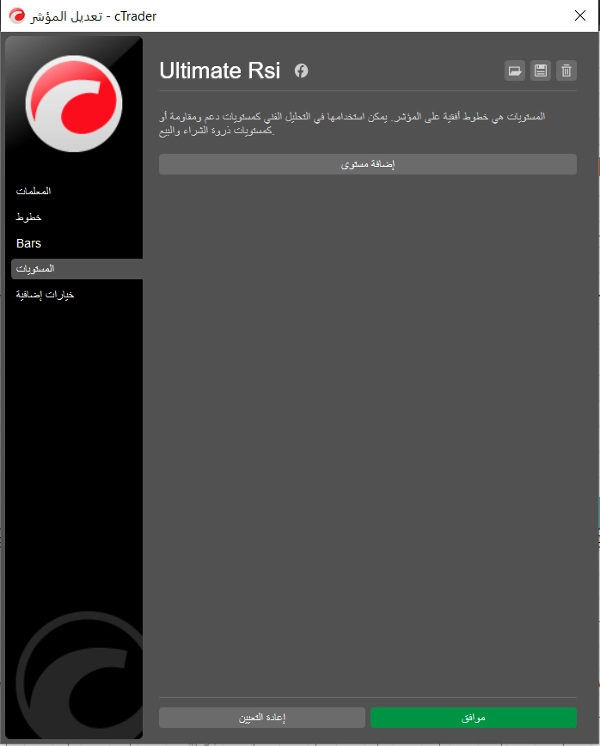
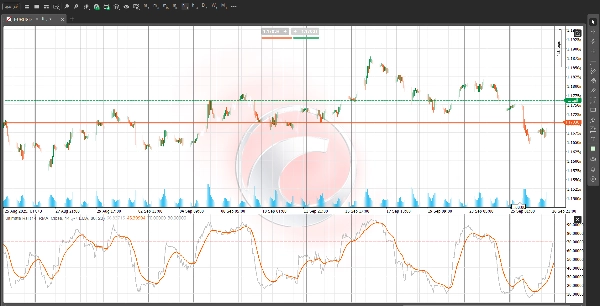
- Zone visive OB/OS: Il livello predefinito di ipercomprato (OB) a 80 e il livello di ipervenduto (OS) a 20 sono chiaramente evidenziati con un'ombreggiatura di sfondo. In mercati con forti trend, letture prolungate all'interno di queste zone spesso indicano una forza del trend eccezionale piuttosto che un'inversione immediata, offrendo uno strumento di conferma potente per strategie di trend-following.
Come operare con l'Ultimate RSI:
- Conferma del trend: Usa il livello 50 come centro del momentum. Una lettura costantemente sopra 50 conferma un bias rialzista, mentre una lettura sotto 50 conferma un bias ribassista.
- Segnali di ingresso: Cerca che la linea Ultimate RSI incroci al di sopra della Linea di Segnale per un potenziale ingresso long, e incroci al di sotto della Linea di Segnale per un potenziale ingresso short, prestando particolare attenzione a dove questi incroci avvengono rispetto al livello 50.
- Riduzione del rumore: Enfatizzando l'espansione del vero range e utilizzando una smussatura avanzata, l'Ultimate RSI aiuta i trader a mantenere la concentrazione durante i periodi di consolidamento, evitando ingressi o uscite premature.
Disclaimer: Questa descrizione è a scopo informativo ed educativo. Il trading comporta rischi e tutte le letture dell'indicatore dovrebbero essere combinate con un'analisi completa dell'azione del prezzo per qualsiasi decisione di trading.


