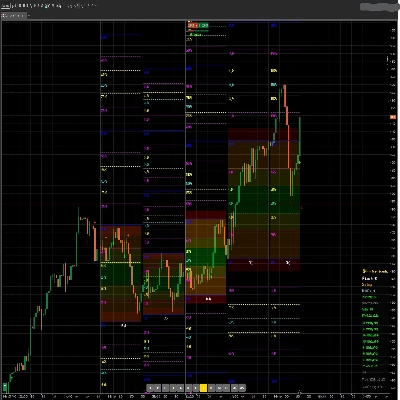
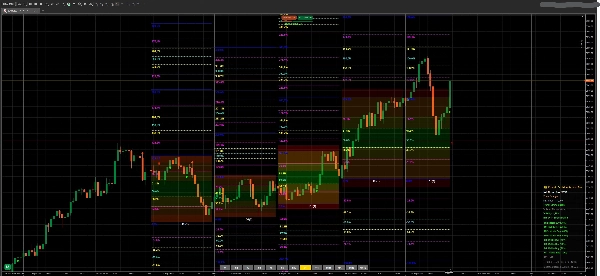
Indicatore
XAUUSD
Commodities
Forex
Fibonacci
Signal
EURUSD
GBPUSD
BTCUSD
Indices
Prop
Stocks
Crypto
USDJPY
CosmicDecisionSystemPro
Logo di "CosmicDecisionSystemPro"
30/09/2025
Desktop
Since 05/12/2024
Immagine caricata di "CosmicDecisionSystemPro"

HTF Analysis, MTF Analysis , Support All Pairs

Expansion Fibo Levels and BUY SELL Signals ,

Potrebbe interessarti anche
Indicatore
VWAP
RSI
XAUUSD
+9
Turtle Soup ICT Strategy
Turtle Soup ICT Strategy – Smart Liquidity Trap Detection for cTrader
ictkillzonesfromnovem
ICT ALL KİLL ZONES, LONDON , ASİA, NY AM, NY LUNCH, NY PM
VWAP-Free
VWAP only timeframe
Più votato
Gratis
Renko Wicks
Renko Wicks
Indicatore
Breakout
Forex
Pivot Point Daily Indicator
Pivot Points Standard — All-in-One Multi-Timeframe Pivot Indicator for cTrader
ICT Killzone and Sessions high_low
This indicator is an essential tool for traders seeking to visualize key trading sessions on their charts.
Reko Wic
Visualize global Forex trading sessions with clear time blocks for better timing and strategy planning.
Indicatore
Indices
Stocks
Forex
+4
MACD Pro Trader
🚀 MACD Pro Trader – Advanced MACD with buy/sell signals, custom MAs & color-coded histograms for smarter trading! 📈🔥
Indicatore
Breakout
ATR
Supertrend
+3
Support Resistance Indicator
A custom support resistance indicator, specifically designed for scalping techniques.
Indicatore
RSI
Breakout
XAUUSD
+5
Prediction Based on Linreg & ATR
📊Predicts price movement by combining multi-timeframe trend analysis, market volatility 📉, and..
Risk Reward Guardian Scalping Swing Intraday Assistant
Trade fearlessly: auto-adjusts order blocks, manages risks, and ensures precision.
Indicatore
Breakout
Stocks
Signal
Darvas Box
The Darvas Box involves identifying "boxes" or trading ranges where a stock's price consolidates before breaking out.
trPDHLC
this indicator shows previous day high low and closed with precise manner.
Indicatore
NAS100
Indices
XAUUSD
+5
Gold Candle 100 Range
Dynamic, color‑coded candles reveal market shifts instantly—spot momentum and trend reversals at a glance
Vishal Volume Profile v2.0
Volume Profile plots traded volume at each price level, highlighting high activity zones of precise support & resistance
IR Macd + MacdLine
some user add moving average to macd to see better. in ctrader 4.3.11 there is a problem with this . I make a macd tha
Indicatore
Indices
RSI
Stocks
+3
FiboTrend-Pro
😎Read the description before purchasing💩
Indicatore
Bollinger
Repiptor BB Colored Width
Colored Bollinger Bands Width