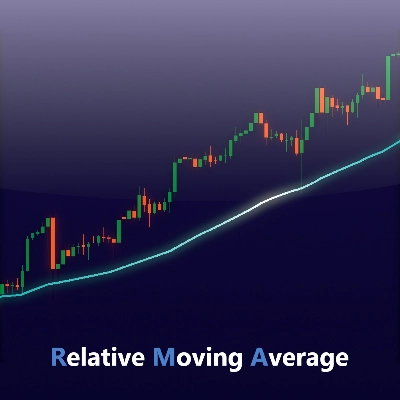
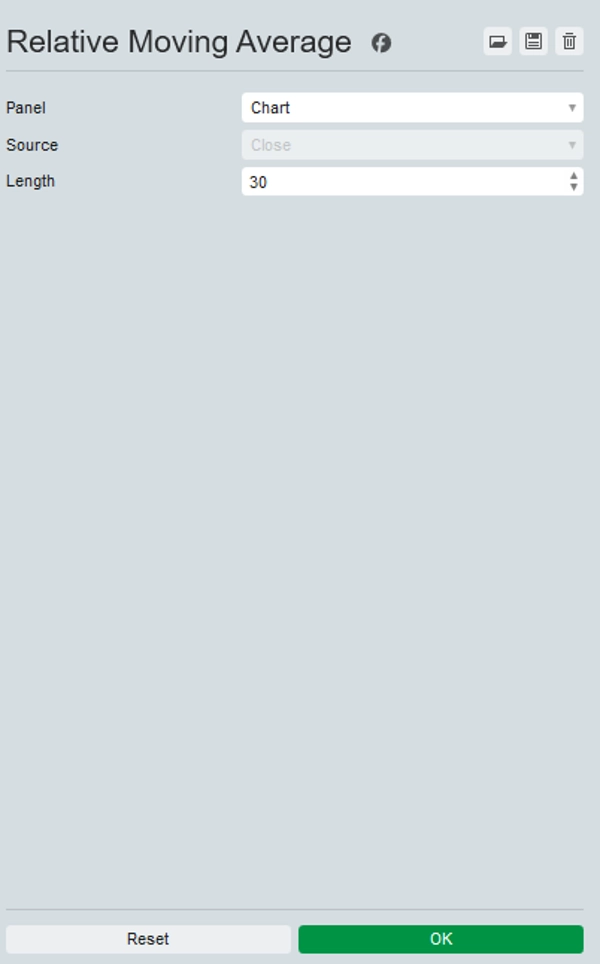
Presentazione dell'indicatore Relative Moving Average (RMA), ora disponibile per cTrader!
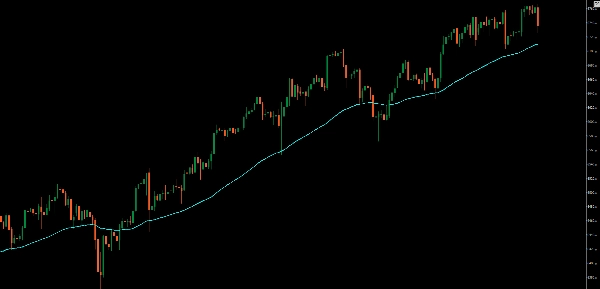
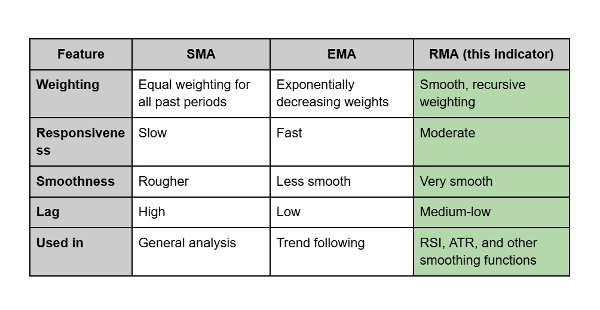
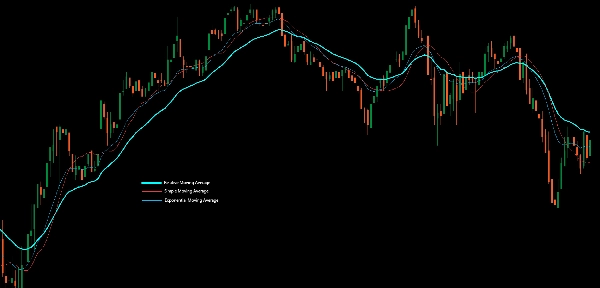
La Relative Moving Average (RMA) — nota anche come Smoothed Moving Average (SMMA) — è un tipo di media mobile che mira a ridurre il ritardo mantenendo la morbidezza della curva. È la stessa formula utilizzata dalla funzione “RMA” integrata di TradingView, ampiamente utilizzata in indicatori popolari come il Relative Strength Index (RSI).
La RMA è progettata per bilanciare reattività e stabilità. Si aggiorna in modo più fluido rispetto a una Exponential Moving Average (EMA) ma reagisce più rapidamente alle variazioni di prezzo rispetto a una Simple Moving Average (SMA).
Come si differenzia:
- La SMA media tutti i prezzi allo stesso modo, causando ritardi e oscillazioni.
- La EMA attribuisce più peso ai prezzi recenti, rendendola molto reattiva ma a volte rumorosa.
- La RMA, al contrario, combina i vantaggi di entrambe: smussa la volatilità mantenendo reazioni tempestive ai cambiamenti di prezzo.
Uso pratico:
I trader spesso utilizzano la RMA come linea di tendenza più morbida o come parte di indicatori di momentum. È particolarmente efficace quando si vuole filtrare il rumore senza introdurre ritardi significativi — ideale per confermare tendenze a lungo termine o supportare analisi di ipercomprato/ipervenduto.


