
Beschreibung
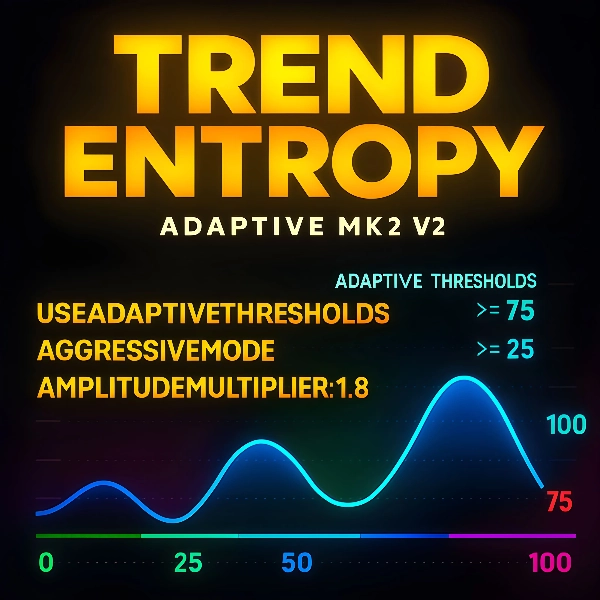
Trend Entropy – Kostenloser cTrader Indikator
Entropie ist das wissenschaftliche Maß für Unordnung oder Unsicherheit in einem System. In der Physik zeigt sie, wie Energie sich verteilt und warum Systeme sich in Richtung Chaos bewegen. In der Informationstheorie misst sie die Unvorhersehbarkeit von Daten. Niedrige Entropie bedeutet Ordnung und Vorhersagbarkeit, während hohe Entropie Zufälligkeit, Komplexität und verringerte Klarheit der Ergebnisse widerspiegelt.
Entdecken Sie die Kraft der Ordnung im Chaos. Trend Entropy ist ein hochmoderner technischer Indikator, der entwickelt wurde, um die Organisation gegenüber der Zufälligkeit von Kursbewegungen zu messen. Im Gegensatz zu traditionellen Oszillatoren, die nur Momentum oder Volatilität verfolgen, wendet Trend Entropy fortschrittliche Entropieberechnungen an, um zu zeigen, ob der Markt strukturiert trendet oder in chaotisches Seitwärtsverhalten driftet.
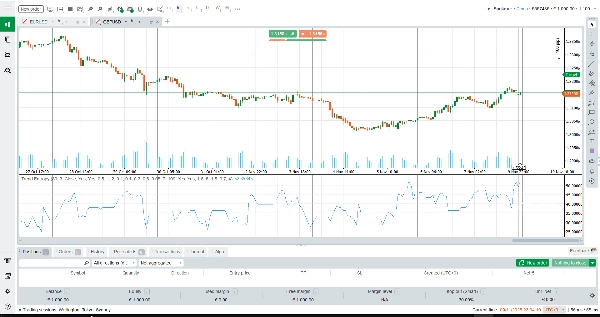
Dieses kostenlose Tool ist für Trader entwickelt, die tiefere Einblicke in die verborgenen Dynamiken der Kursbewegung wünschen. Durch die Kombination von statistischer Entropie mit RSI-ähnlicher Glättung und adaptiven Schwellenwerten verwandelt Trend Entropy rohe Volatilität in eine klare, normalisierte Skala von 0 % bis 100 %. Das Ergebnis ist eine einzelne, elegante Linie, die anzeigt, ob sich der Markt in einem starken Trend, einer neutralen Konsolidierung oder einer volatilen Seitwärtsphase befindet.
Wie man Trend Entropy liest
Niedrige Werte (0–33 %): Der Markt ist organisiert. Wenn die durchschnittliche Rendite positiv ist, deutet dies auf einen wahrscheinlichen Aufwärtstrend hin. Ist sie negativ, signalisiert dies einen wahrscheinlichen Abwärtstrend.
Mittlere Werte (34–66 %): Neutrales Gebiet. Der Markt könnte sich konsolidieren, mit einer leichten Tendenz zu bullisch oder bärisch, abhängig von der durchschnittlichen Rendite.
Hohe Werte (67–100 %): Chaos dominiert. Die Kursbewegung ist seitwärts, unvorhersehbar und weniger zuverlässig für trendfolgende Strategien.
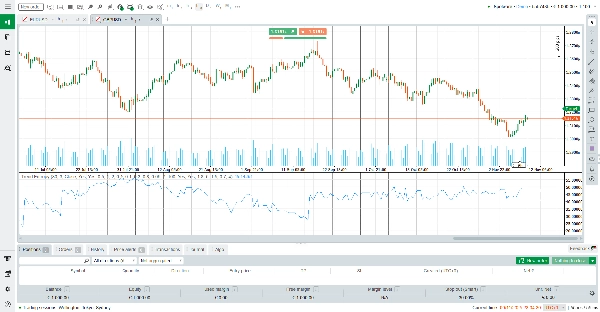
Horizontale Referenzlinien bei 25 %, 50 % und 75 % erleichtern die Interpretation. Trader können sofort erkennen, ob die Entropie sich in Richtung Ordnung zusammenzieht oder sich in Richtung Chaos ausdehnt.
Wie der Indikator funktioniert
Trend Entropy berechnet Renditen über einen gewählten Zeitraum und ordnet sie symbolischen Zuständen zu. Diese Zustände werden in überlappenden Fenstern analysiert, um eine Häufigkeitsverteilung von Kursmustern zu erstellen. Mithilfe der Entropiemathematik misst der Indikator den Grad der Unordnung in diesen Sequenzen.
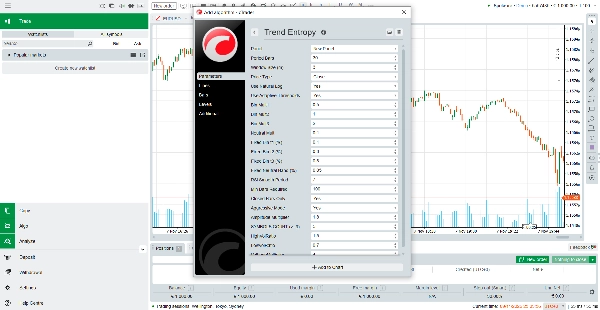
Um das Ergebnis praktisch zu machen, wird die rohe Entropie auf eine prozentuale Skala normalisiert und anschließend mit einer Wilder-ähnlichen Glättungsmethode geglättet. Adaptive Schwellenwerte sorgen dafür, dass sich der Indikator an die aktuelle Volatilität anpasst, während der aggressive Modus Signale für Trader verstärkt, die schärfere Reaktionen bevorzugen. Schließlich werden Volatilitätsverhältnisse angewendet, um die Messung zu verfeinern, indem Werte in chaotischen Bedingungen nach oben und in stabilen nach unten verschoben werden.
Das Endergebnis ist eine einzelne geglättete Linie, die das Wesen der Marktstruktur einfängt: ob der Kurs geordnet trendet oder in Zufälligkeit driftet.
Hauptmerkmale
Entropiebasierte Analyse – Geht über Momentum hinaus, um die wahre Organisation der Kursbewegung zu messen.
Adaptive Schwellenwerte – Passen sich automatisch an die Volatilität an und halten Signale unter allen Marktbedingungen relevant.
RSI-ähnliche Glättung – Bietet eine klare, stabile Linie, die rauschende Schwankungen vermeidet.
Volatilitätsintegration – Verbessert die Genauigkeit durch den Vergleich von kurzfristigen und langfristigen Volatilitätsverhältnissen.
Klares visuelles Design – Horizontale Referenzlinien und eine einzelne DodgerBlue-Linie machen die Interpretation mühelos.
Warum Trend Entropy wählen?
Trend Entropy ist nicht nur ein weiterer Oszillator. Es ist ein hybrides Tool, das statistische Strenge mit traderfreundlicher Visualisierung kombiniert. Ob Sie ein Trendfolger sind, der eine Bestätigung sucht, oder ein Range-Trader, der chaotische Märkte vermeiden möchte – dieser Indikator gibt Ihnen die Klarheit, die Sie brauchen.
Zusammenfassung
The indicator outputs a single smoothed line on a normalized scale from 0% to 100%, where low values (0–33%) indicate organized trending markets, mid values (34–66%) suggest neutral or consolidating conditions, and high values (67–100%) reflect chaotic, ranging markets. Horizontal reference lines at 25%, 50%, and 75% aid interpretation.
Trend Entropy pro incorporates RSI-style smoothing, adaptive thresholds that adjust to current volatility, and volatility ratio integration to enhance signal accuracy. It is designed to provide traders with deeper insight into market dynamics beyond traditional momentum or volatility indicators, supporting analysis across various markets including Forex, cryptocurrencies, commodities, indices, and stocks.
This indicator is suitable for traders seeking to identify trending versus ranging conditions and improve decision-making in trend-following or range-trading strategies.


