
Descrizione
Indicatore Delta Volume - Analisi Avanzata del Flusso Ordini per cTrader
L'Indicatore Delta Volume analizza il flusso ordini tick per tick per rivelare la pressione di acquisto e vendita che l'azione del prezzo da sola non può mostrare. Calcola la differenza tra uptick (acquisti) e downtick (vendite) per ogni barra, fornendo approfondimenti sulla vera partecipazione al mercato.
Versione 1.0
Versione attualmente stabile per timeframe inferiori (1m - 15m)
Aggiornamenti in arrivo presto!
Cosa lo rende unico
Analisi reale a livello di tick: Non un'approssimazione del volume - classificazione reale dei tick
Sistemi di Divergenza Doppia: Rilevamento della divergenza sia a livello di barra che basato su frattali
Validazione della Qualità: La stima dello spread Corwin-Schultz garantisce segnali affidabili
Visualizzazione Flessibile: Molteplici metodi di colorazione e opzioni di filtraggio
Personalizzazione Completa: Ogni colore, soglia e opzione di visualizzazione configurabile
Basato sulla Ricerca: Costruito su ricerche peer-reviewed sulla microstruttura di mercato
------------------------------------------------------------------------------------------------------------------------------------------------------------
Caratteristiche principali
------------------------------------------------------------------------------------------------------------------------------------------------------------
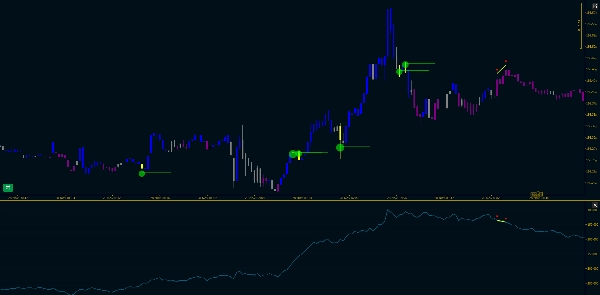
Calcolo Delta Volume
- Classificazione Regola Tick: Ogni tick classificato come acquisto (+1), vendita (-1) o neutro (0)
- Delta Barra: Pressione netta di acquisto/vendita per barra = Volume Acquisti - Volume Vendite
- Delta Cumulativo: Somma progressiva che mostra la pressione direzionale persistente
- Tipi di Prezzo Multipli: Calcolo usando prezzi Bid, Ask o Mid
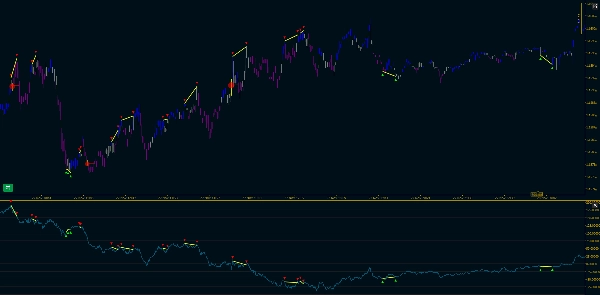
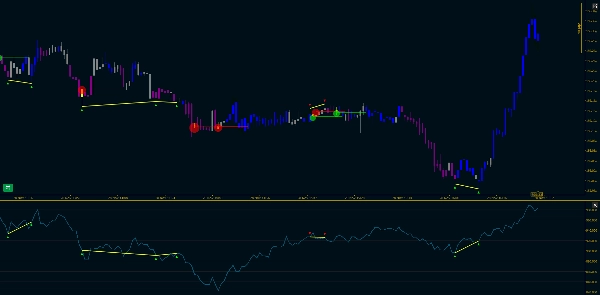
Rilevamento Divergenza Delta
Identifica quando prezzo e flusso ordini non sono d'accordo - un potenziale segnale di inversione.
Due Metodi di Filtro:
- Magnitudine + Squilibrio: Soglie dirette per forza delta e squilibrio di volume
- Basato su Percentili: Filtraggio adattivo basato sulla distribuzione storica
Indicatori Visivi:
- Posizionati automaticamente al Punto di Controllo (livello di prezzo con il volume più alto)
- Dimensione scala con la magnitudine delta
- Linee di tendenza opzionali che si estendono in avanti
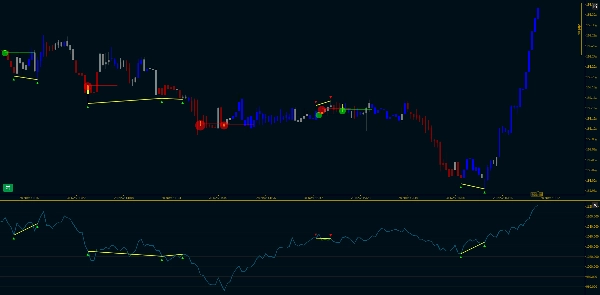
Colorazione Candele del Grafico
Colora le candele in base al flusso ordini con tre livelli di priorità:
- Divergenza (Giallo) - massima priorità
- Regime CVD (opzionale) - identificazione di regime stabile
- Delta Barra (Lime/Rosso/Grigio) - colorazione barra per barra
------------------------------------------------------------------------------------------------------------------------------------------------------------
Analisi Regime CVD
------------------------------------------------------------------------------------------------------------------------------------------------------------
Due Metodi per una Colorazione Stabile:
1. Posizione nel Range
- Mostra dove si trova il CVD nel range recente (0-100%)
- Parte superiore 30% = Rialzista | Parte inferiore 30% = Ribassista | Parte centrale 40% = Neutrale
- Veloce, intuitivo, auto-adattativo
2. Filtro di Qualità Corwin-Schultz
- Utilizza la stima reale dello spread Corwin-Schultz sul prezzo
- Si fida del CVD solo quando la liquidità di mercato è alta (spread stretto)
- Filtra automaticamente i periodi non affidabili
- Basato su ricerche peer-reviewed (Corwin & Schultz 2012)
Principio Chiave: Il CVD ha significato solo nei mercati liquidi. Questo metodo valida la qualità del mercato prima di mostrare i segnali CVD.
------------------------------------------------------------------------------------------------------------------------------------------------------------
Analisi Frattale Prezzo-Delta
------------------------------------------------------------------------------------------------------------------------------------------------------------
Traccia simultaneamente i punti pivot sia sul grafico dei prezzi che sul delta cumulativo.
Caratteristiche:
- Rileva frattali alti/bassi con lunghezze pivot configurabili
- Tracciamento sequenziale: segue massimi consecutivi o minimi consecutivi
- Rilevamento divergenza: confronta la pendenza del prezzo con la pendenza del CVD tra i pivot
- Visualizzazione doppia: indicatori e linee di tendenza sia sul grafico dei prezzi che sul pannello indicatore
- Filtro Opzionale: Mostra solo i frattali divergenti per una vista pulita e focalizzata
------------------------------------------------------------------------------------------------------------------------------------------------------------
Output Visivo
------------------------------------------------------------------------------------------------------------------------------------------------------------
Pannello Indicatore
- Istogramma Delta: Barre bianche (normali), barre gialle (divergenze)
- Linea Delta Cumulativo: Linea ciano che mostra il flusso ordini in corso
- Linea di Riferimento Zero: Linea tratteggiata grigia
- Indicatori Frattali: ▼ (massimi) e ▲ (minimi) con linee di tendenza
Grafico Prezzi
- Candele Colorate: Rappresentazione visiva del regime del flusso ordini
- Indicatori Frattali: Sincronizzati con il pannello indicatore
- Linee di Tendenza Frattali: Collegano i pivot evidenziando le divergenze
- Indicatori di Divergenza: Cerchi al Punto di Controllo
------------------------------------------------------------------------------------------------------------------------------------------------------------
Riferimenti
------------------------------------------------------------------------------------------------------------------------------------------------------------
- Corwin, S. A., & Schultz, P. (2012). "A Simple Way to Estimate Bid-Ask Spreads from Daily High and Low Prices." The Journal of Finance, 67(2), 719-760.
- López de Prado, M. (2018). Advances in Financial Machine Learning, Capitolo 19.
- Lee, C. M., & Ready, M. J. (1991). "Inferring Trade Direction from Intraday Data." The Journal of Finance, 46(2), 733-746.


