Opis
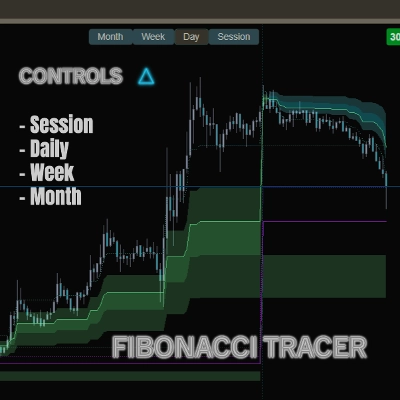
Fibonacci Tracer automatycznie rysuje i aktualizuje poziomy Fibonacciego zostawiając widoczny ślad ich rozwoju.
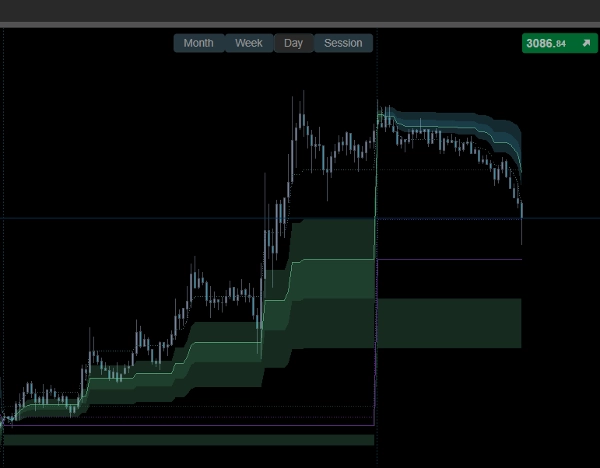
Pozwala to zobaczyć nie tylko statyczne poziomy, ale także jak Fibonacci ewoluuje wraz z rynkiem w czasie — co jest znacznie ważniejsze niż izolowane linie.
Szybkie przyciski kontrolne na wykresie pozwalają natychmiast przełączać się między widokami Sesji, Dnia, Tygodnia i Miesiąca, dzięki czemu możesz śledzić, jak Fibonacci rozwijał się na różnych horyzontach czasowych.
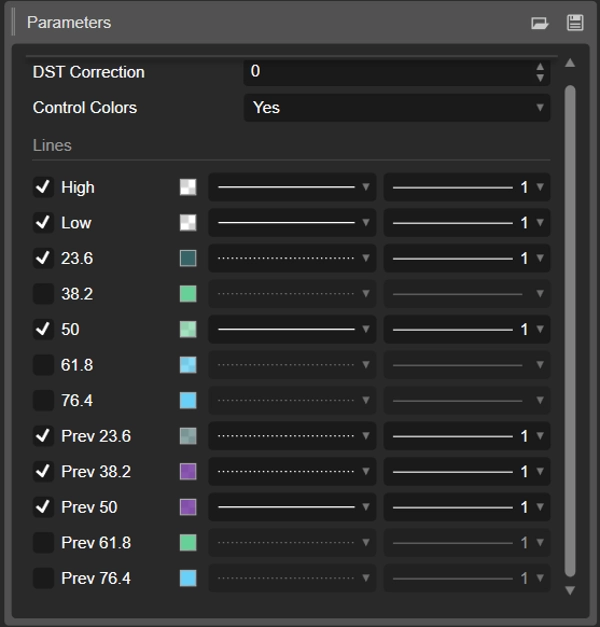
Po włączeniu wskaźnika otwórz ustawienia i wyłącz pola wyboru dla linii (jak pokazano na poniższym obrazku). Usuwa to niechciane kropki i daje tę samą miękką, przyjazną dla oka kolorystykę jak na okładce.
Większości wskaźników brakuje kluczowych szczegółów — ignorują przejścia rynkowe — weekendy i nocne przewinięcie, kiedy płynność resetuje się do zera — kontynuując obliczenia tam, gdzie faktycznie potrzebny jest reset i świeże odczyty rynku; to tylko mały fragment mojego doświadczenia, ale jego zrozumienie może już zmienić sposób, w jaki postrzegasz rynki.
Podsumowanie
Opinie klientów
5 | 50 % | |
4 | 50 % | |
3 | 0 % | |
2 | 0 % | |
1 | 0 % |


