EKVWAP
Indikator
2.57K muat turun
Versi 1.0, Jan 2025
Windows, Mac
4.3
Ulasan: 6
Penerangan
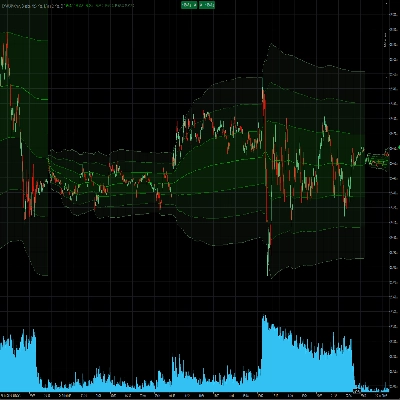
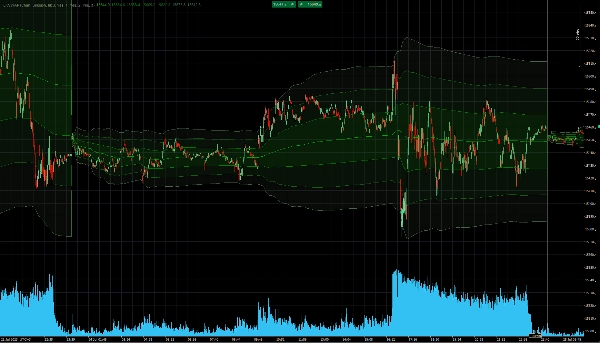
Ini adalah penunjuk VWAP lanjutan yang membolehkan anda menyesuaikan semua aspek daripadanya.
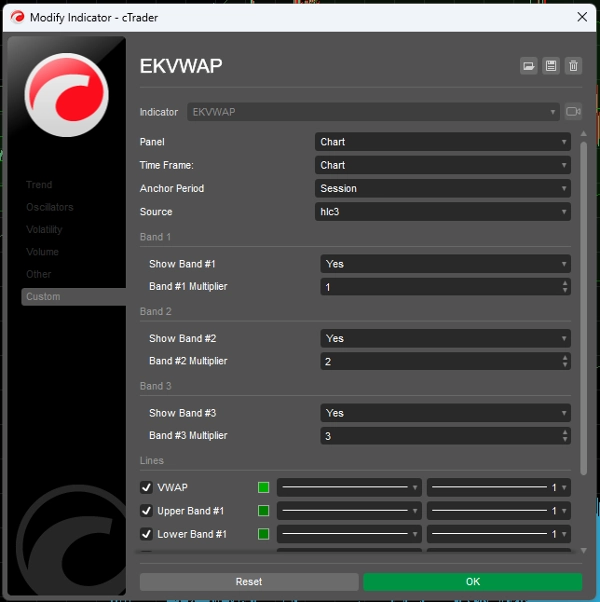
Anda boleh menetapkan VWAP untuk berlabuh:
- Kepada titik sauh manual.
- Mengikut Sesi sekiranya pasaran mempunyai pelbagai sesi dalam hari yang sama (contoh: HK50 atau AUS200),
- Mengikut Hari
- Mengikut Minggu
Ia menyokong paparan sehingga 3 jalur Sisihan Piawai. Anda boleh menetapkan warna tersuai untuk setiap jalur dan juga menetapkan pengganda mereka atau hanya sembunyikan/tunjukkan mereka.
Titik sauh manual:
Setelah anda klik pada bar pada graf, tekan kekunci Alt-A (boleh dikonfigurasikan dalam pilihan) untuk menetapkan titik sauh manual bagi pengiraan VWAP. Pengiraan akan bermula dari titik anda semasa menekan kekunci Alt-A. Menekan Alt-A sekali lagi akan keluar dari pengiraan VWAP manual dan kembali ke pengiraan sebelumnya.
Ringkasan
Ringkasan AI
EKVWAP is an advanced Volume Weighted Average Price (VWAP) indicator designed for customizable technical analysis. It allows users to anchor the VWAP calculation to various points, including a manual anchor set directly on the chart, by trading session (useful for markets with multiple daily sessions such as HK50 or AUS200), by day, or by week. The indicator supports the display of up to three standard deviation bands, each with configurable multipliers and colors, which can be shown or hidden according to user preference. Manual anchoring is enabled by selecting a bar on the chart and activating the anchor point via a configurable keyboard shortcut, allowing the VWAP calculation to start from that specific point. This flexibility facilitates detailed volume-based price analysis across different timeframes and market sessions.
Profil indikator
Ulasan pelanggan
4.3
Ulasan: 6
5 | 50 % | |
4 | 33 % | |
3 | 17 % | |
2 | 0 % | |
1 | 0 % |
Ulasan pelanggan
August 21, 2025
Nice indicator. My major issue with it is that it automatically fills the bands with the colour selected for the lines. There is no facility to deselect this. Please add the capability to deselect band fill as it can be obtrusive, especially if using colours for another indicator on the chart.
July 9, 2025
Pros: Flexible anchored VWAP with customizable start point. Visual cloud of deviations. Easy integration and stable performance. Cons: No alerts on key levels. No statistics on VWAP re-tests. Lacks tooltip information and quick template saving.
June 18, 2025
June 5, 2025
Really good. all i think is left, is making one on UCT 0. Can you do That? I need to use this indicator to be a reference to a cBot, but i cant do that because the system dont have access to the code. Can you sell one to be used by cBot ¡please!.
Perbincangan
Soalan Lazim
VWAP
Produk yang tersedia melalui cTrader Store, termasuk bot dagangan, indikator dan plugin, disediakan oleh pembangun pihak ketiga dan diberikan akses untuk tujuan maklumat dan teknikal sahaja. cTrader Store bukan broker dan tidak memberikan nasihat pelaburan, syor peribadi atau sebarang jaminan prestasi masa hadapan.


Harga
Sejak 27/11/2024
14.22M
Volum yang didagangkan
8.76K
Pip dimenangi
2.57K
Pemasangan percuma