คำอธิบาย
ตัวบ่งชี้สเกลปปิ้งขนาดกะทัดรัดสำหรับ cTrader ที่รวมสามสิ่งไว้ในเลเยอร์ที่สะอาดเดียว: VWAP รายวันตามเซสชัน, คู่มือช่วงเปิดตลาด, ฟอง “เดลต้า/พลัง” เป็นตัวบ่งชี้โมเมนตัม/กิจกรรม และโซนอุปทาน/อุปสงค์แบบไดนามิกพร้อมสถานะทดสอบ/ยืนยัน รวมถึงตัวกรองแนวโน้มที่เป็นทางเลือก นอกจากนี้ยังมีไฟจราจรหลายกรอบเวลาที่แสดงทิศทางของแท่งเทียนที่ปิดล่าสุดในหลายกรอบเวลา (VWAP + ช่วงเปิดตลาด) ได้อย่างรวดเร็ว
หมายเหตุ: พารามิเตอร์ถูกออกแบบมาอย่างตั้งใจเพื่อให้คุณสามารถปรับเครื่องมือให้เข้ากับตลาด/กรอบเวลาได้อย่างรวดเร็ว; ตรรกะทำงานโดยอัตโนมัติในพื้นหลัง
สิ่งที่คุณจะได้รับ (คุณสมบัติ)
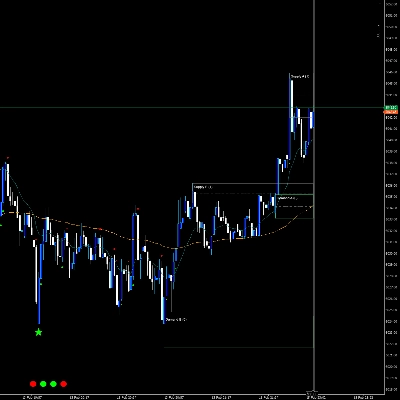
- VWAP รายวัน (รีเซ็ตทุกวันซื้อขาย): แสดงราคายุติธรรม “ราคาตามเซสชัน” และช่วยในการกลับสู่ค่าเฉลี่ย, การดึงกลับ และแนวโน้มทิศทาง
- ช่วงเปิดตลาด (OR) สูง/ต่ำ: วาดช่วงเปิดตลาดเพื่อให้คุณสามารถจัดโครงสร้างการตั้งค่าการเบรกเอาต์/การกลับตัว (นาทีที่กำหนดอัตโนมัติหรือด้วยตนเอง)
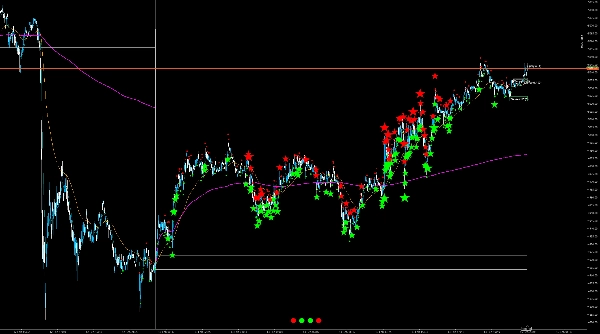
- ฟองเดลต้า/พลัง: เน้นแท่งเทียนที่มีกิจกรรมสูงกว่าค่าเฉลี่ย (ขึ้นอยู่กับโหมด: ปริมาณพุ่ง, ปริมาณช่วง/ตัวแทนปริมาณตัวแทนเดลต้า) และระบายสีตามทิศทาง (กระทิง/หมี)
- โซนอุปทาน/อุปสงค์ (ชุดจุดหมุนสองชุด A/B): โซนอัตโนมัติจากจุดหมุนสูง/ต่ำที่ได้รับการยืนยัน พร้อมความลึกโซนตาม ATR, การขยายด้านขวาที่กำหนด และเส้นกลางที่เป็นทางเลือก
- สถานะโซน: “ใหม่ → ทดสอบ → ยืนยัน” (การยืนยันโดยเงื่อนไขปริมาณเป็นทางเลือก) เพื่อให้คุณเห็นได้ทันทีว่าโซนถูกซื้อขายไปแล้วหรือไม่และตอบสนองด้วยความแข็งแกร่งหรือไม่
- ตัวกรองแนวโน้ม (เป็นทางเลือก): ตัวกรอง EMA หรือ EMA+ADX เพื่อให้แสดง/พิจารณาโซนเฉพาะในทิศทางแนวโน้ม (เช่น โซนอุปสงค์เฉพาะในแนวโน้มขาขึ้น)
- ไฟจราจรหลายกรอบเวลา: แสดง M1/M5/H1/D1 เป็นสีเขียว/แดง/เทา ขึ้นอยู่กับแท่งเทียนที่ปิดล่าสุด—บริบทที่มีประโยชน์โดยไม่ต้องเปลี่ยนกรอบเวลาแผนภูมิ
สิ่งที่ผู้ซื้อสามารถกำหนดค่าได้ (ภาพรวมพารามิเตอร์)
การตั้งค่าถูกจัดกลุ่มและออกแบบมาเพื่อความใช้งานจริง:
แกนหลัก
- ความยาว ATR: อินพุตฐานสำหรับความลึกโซนและเมตริกฟองบางอย่าง
- แสดง VWAP รายวัน: เปิด/ปิด
- แสดงช่วงเปิดตลาด: เปิด/ปิด
- โหมด OR: อัตโนมัติ (ขึ้นอยู่กับกรอบเวลาแผนภูมิ) หรือด้วยตนเอง (นาทีคงที่)
- ปัจจัยอัตโนมัติ OR / นาที OR: ปรับแต่งระยะเวลาช่วงเปิดตลาด
ตัวกรองแนวโน้ม
- โหมด: ปิด / EMA / EMA+ADX
- EMA เร็ว / EMA ช้า: ทิศทางแนวโน้มผ่านการตัดกัน/ความสัมพันธ์ของ EMA
- ความยาว ADX + เกณฑ์: ความแข็งแกร่งแนวโน้มขั้นต่ำเมื่อเปิดใช้งาน EMA+ADX
- แสดงเส้น EMA: แสดงตัวกรอง EMA บนแผนภูมิเป็นทางเลือก
ฟอง
- แสดงฟอง: เปิด/ปิด
- ตัวแทนเดลต้า: สามแบบ (น้ำหนักช่วง, ปิดเทียบกับก่อนหน้า, ปิดเทียบกับเปิด) ขึ้นอยู่กับเครื่องมือ/ฟีด
- เมตริกฟอง: อัตโนมัติหรือเมตริกคงที่ (เดลต้าสัมบูรณ์, ปริมาณพุ่ง, ปริมาณตัวแทนช่วง/ตัวแทนตัวแทน)
- การย้อนดูควอนไทล์ + % ควอนไทล์: ควบคุมว่าคลื่นสัญญาณฟอง “หายาก” แค่ไหน (เปอร์เซ็นต์สูง = เหตุการณ์ที่แข็งแกร่งกว่าเท่านั้น)
- ขีดจำกัดป้ายชื่อ: จำนวนป้ายฟองที่เหลือบนแผนภูมิ (ประสิทธิภาพ/ความชัดเจน)
- ฟอนต์ฐาน + โหมด 4K: การปรับขนาดภาพสำหรับจอความละเอียดสูง
- รูปร่างฟองเล็ก/ใหญ่: รูปร่างฟอง (จุด/วงกลม ฯลฯ)
- ดีบัก: บังคับฟอง (สำหรับการทดสอบเท่านั้น)
โซน
- แสดงโซน: เปิด/ปิด
- ความลึกโซน × ATR: ความหนาของโซน (ปรับตามความผันผวน)
- ขยาย (แท่ง): ระยะที่โซนขยายไปทางขวา
- แสดงเส้นกลาง: เปิด/ปิด
- โซนเฉพาะในแนวโน้ม: แสดงโซนเฉพาะเมื่อทิศทางตัวกรองแนวโน้มตรงกัน
- พารามิเตอร์จุดหมุน A & B (ซ้าย/ขวา): ความไวสองระดับ (เช่น โซน “หยาบ” + “ละเอียด”)
- ขนาดป้ายโซน: เล็ก/กลาง/ใหญ่
- สี (ARGB): สีแยกสำหรับอุปทาน/อุปสงค์, ทดสอบ, ยืนยัน + เส้นกลาง
- ยืนยันโดยปริมาณ + vol-MA/ตัวคูณ: ยืนยันเฉพาะเมื่อปริมาณติกเกิน MA × ปัจจัย
ไฟจราจร
- แสดงไฟจราจร: เปิด/ปิด
- ฟอนต์ + ขนาด 4K: ขนาด/ความอ่านง่าย
- อัปเดตทุก N แท่ง: ความถี่การอัปเดต (ประสิทธิภาพกับการตอบสนอง)
(คำอธิบายฟิลด์พารามิเตอร์สามารถนำเสนอได้อย่างชัดเจนผ่านแอตทริบิวต์/คำอธิบายพารามิเตอร์; แพลตฟอร์มรองรับการจัดกลุ่มและคำอธิบายโดยตรงใน UI พารามิเตอร์)
เหมาะสำหรับใคร
- นักสเกลปและเทรดเดอร์รายวันที่ต้องการบริบทอย่างรวดเร็ว: VWAP/OR สำหรับโครงสร้าง, ฟองสำหรับ “กิจกรรม”, โซนสำหรับพื้นที่ตอบสนอง
- เทรดเดอร์ที่ต้องการการแสดงผลที่ชัดเจนโดยไม่ต้องซ้อนตัวบ่งชี้หลายตัว
- ผู้ใช้ที่อาจต้องการมุมมองที่กรองแนวโน้มเป็นทางเลือก (EMA/ADX) ในขณะที่ยังคงแกนหลักเป็นการแสดงผลแบบเสียบและเล่น
การใช้งานทั่วไป (สั้นและใช้งานได้จริง)
ตรวจสอบอคติผ่าน VWAP + ไฟจราจร และใช้ OR เป็น “โซนต่อสู้” ในช่วงเปิดตลาด
ใช้ฟองเป็นเบาะแสว่า “มีบางอย่างที่เหนือกว่าค่าเฉลี่ยเกิดขึ้นที่นี่” (เบรกเอาต์, การดูดซับ, แรงกระตุ้น)
ใช้โซนเป็นพื้นที่วางแผน: การสัมผัสครั้งแรก = “ทดสอบ”; ปฏิกิริยาที่มีปริมาณสูงสามารถทำเครื่องหมายว่า “ยืนยัน”; เส้นกลางช่วยในการเทรดระดับต่อระดับอย่างชัดเจน


