

Descrizione
📉 SMARTZIG — IL VISUALIZZATORE DEFINITIVO DELLA STRUTTURA DI MERCATO ( VERSIONE 🇧🇷 BASSA)
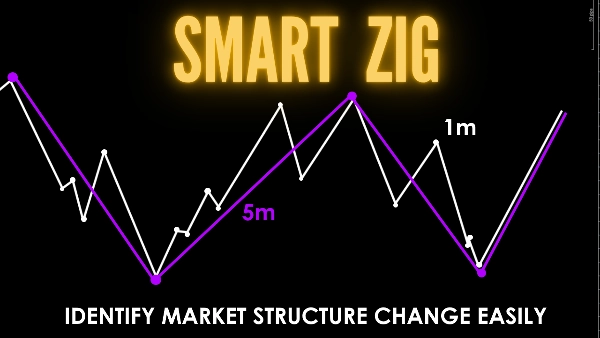
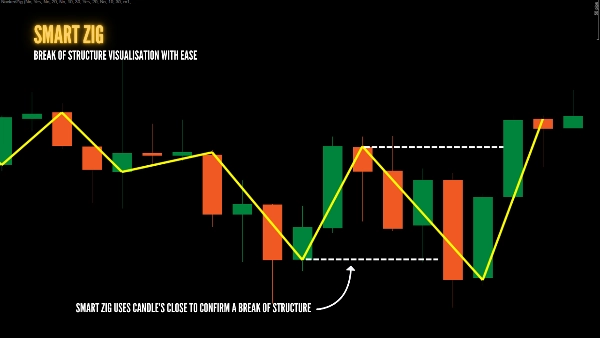
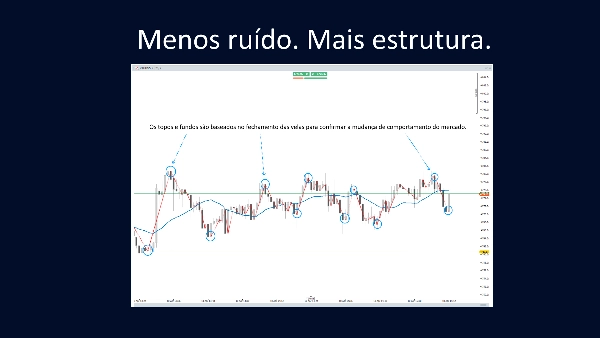
Leggi l'azione del prezzo come un professionista. SmartZig elimina il rumore delle ombre mappando la struttura direttamente dai corpi delle candele (apertura e chiusura). Evita falsi breakout sovrapponendo simultaneamente le oscillazioni di un timeframe inferiore (LTF) a quelle di un timeframe superiore (HTF) per individuare più facilmente cambiamenti nella struttura del mercato e variazioni nello stato di consegna (CISD), ottieni conferme dell'azione del prezzo e sweep di liquidità affidandoti all'apertura e chiusura invece che alle ombre. Nascondi le barre del grafico per maggiore chiarezza durante la tua analisi tecnica.
✅ PERCHÉ AGGIORNARE A SMARTZIG?
- Motore Zigzag Doppio: Esegui due ZigZag indipendenti per vedere contemporaneamente trend veloci e lenti.
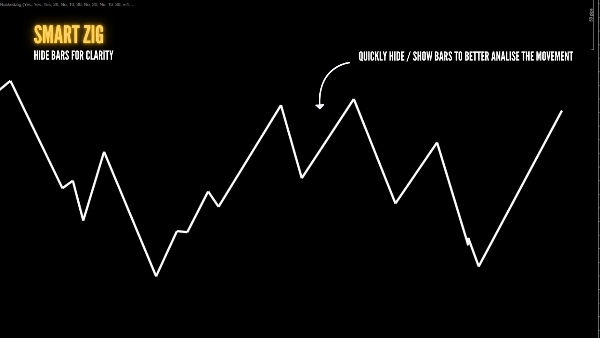
- Modalità Grafico Nudo: Nascondi tutte le barre delle candele con un clic per concentrarti solo sullo scheletro ZigZag.
- Precisione Basata sul Corpo: I pivot sono derivati dai livelli di apertura/chiusura, evitando falsi breakout delle ombre.
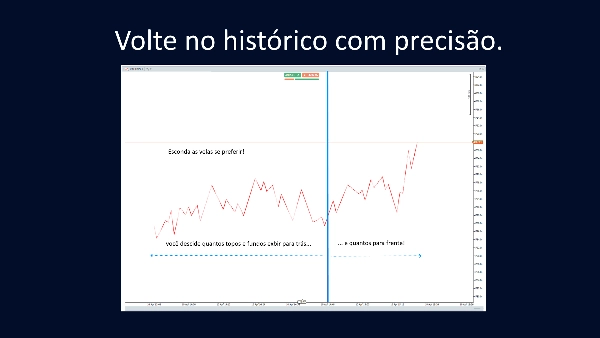
- Storia Interattiva: Trascina l'ancora verticale per rivelare immediatamente le gambe strutturali in qualsiasi sessione passata.
- Timeframe Indipendenti: Imposta periodi di origine diversi per LTF e HTF senza cambiare grafico.
- Esecuzione Pulita: Smetti di disegnare manualmente e lascia che l'indicatore aggiorni le tue oscillazioni in tempo reale.
📺 GUARDA IL TUTORIAL & UNISCITI ALLA COMMUNITY:
(Per favore, posta le tue domande/richieste di supporto nei commenti del video per aiutare la nostra community a crescere!)
🛠️ CARATTERISTICHE PRINCIPALI:
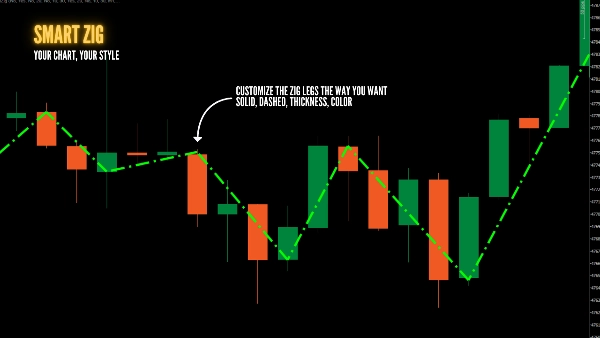
- Stile Personalizzabile: Colori, spessori e stili di linea separati per ogni ZigZag.
- Filtro delle Gambe: Scegli esattamente quante gambe storiche vuoi vedere.
- Ancore Trascinabili: Sposta il focus dello studio su qualsiasi barra storica con il mouse.
- Interruttore di Visibilità Totale: Nascondi o mostra l'intero studio istantaneamente per liberare lo schermo.
🇧🇷 SMARTZIG — IL VISUALIZZATORE DEFINITIVO DELLA STRUTTURA DI MERCATO
Analizza l'azione del prezzo (Price Action) come un professionista. Il SmartZig elimina il rumore delle ombre mappando la struttura direttamente dai corpi delle candele (apertura e chiusura). Evita falsi breakout sovrapponendo simultaneamente i movimenti di un periodo di tempo inferiore (LTF) a un periodo di tempo superiore (HTF) per identificare più facilmente cambiamenti nella struttura del mercato e variazioni nello stato di consegna (CISD). Ottieni conferma dell'azione del prezzo e degli sweep di liquidità basandoti sull'apertura e chiusura invece che sulle ombre. Nascondi le barre del grafico per maggiore chiarezza durante la tua analisi tecnica.
✅ PERCHÉ PASSARE A SMARTZIG?
- ZigZag Doppio: Esegui due ZigZag indipendenti per vedere contemporaneamente tendenze veloci e lente.
- Modalità Grafico Pulito: Nascondi tutte le candele con un clic e concentrati solo sul "scheletro" del mercato.
- Precisione Basata sul Corpo: Pivot derivati da apertura/chiusura, evitando falsi breakout delle ombre.
- Interattività Storica: Trascina l'ancora verticale per rivelare gambe strutturali in qualsiasi sessione passata.
- Timeframe Indipendenti: Imposta periodi di origine diversi per LTF e HTF senza cambiare grafico.
- Esecuzione Veloce: Smetti di disegnare manualmente gli swing; lascia che l'indicatore aggiorni la struttura in tempo reale.
📺 GUARDA IL TUTORIAL E RISOLVI I TUOI DUBBI:
(Per favore, posta le tue domande e richieste di supporto nei commenti del video sopra per aiutare il maggior numero di persone!)
🛠️ CARATTERISTICHE TECNICHE:
- Stile Personalizzabile: Colori, spessori e stili di linea indipendenti per ogni ZigZag.
- Filtro delle Gambe: Scegli esattamente quante gambe storiche vuoi visualizzare.
- Ancore Trascinabili: Sposta il focus dello studio su qualsiasi barra storica usando il mouse.
- Interruttore di Visibilità Totale: Nascondi o mostra l'intero studio istantaneamente per liberare lo schermo.
Riepilogo
Key features include a dual ZigZag engine that tracks fast and slow trends independently, customizable styling for colors and line thickness, and interactive history with draggable vertical anchors to explore past structural legs. It supports independent timeframe settings for LTF and HTF without switching charts and updates swings in real-time, eliminating the need for manual drawing. Additional functionalities include leg filtering to control the number of visible historical legs and a full visibility toggle to declutter the chart.
SmartZig is tagged for key levels, break of structure (BOS), liquidity sweeps and grabs, change of character (CHOCH), market structure, and support/resistance analysis. It provides a visual tool for technical analysts to read price action more accurately and confirm liquidity events based on open-close pivots. A tutorial video is available for user guidance.
Recensioni dei clienti
Discussioni
Domande frequenti






















Prezzo