present
Registrati e ricevi uno sconto da $50 sul tuo primo acquisto
Trading product for TradeLens Indicatore Chart UI Tools Key Levels, image 1
TradeLens
Indicatore
Versione 1.3, Sep 2026
Windows, Mac
4.5
Recensioni: 4
Trading product for TradeLens Indicatore Chart UI Tools Key Levels, image 2
Trading product for TradeLens Indicatore Chart UI Tools Key Levels, image 3
Trading product for TradeLens Indicatore Chart UI Tools Key Levels, image 4
Trading product for TradeLens Indicatore Chart UI Tools Key Levels, image 5
Trading product for TradeLens Indicatore Chart UI Tools Key Levels, image 6
Trading product for TradeLens Indicatore Chart UI Tools Key Levels, image 7
Trading product for TradeLens Indicatore Chart UI Tools Key Levels, image 8
Trading product for TradeLens Indicatore Chart UI Tools Key Levels, image 9
Trading product for TradeLens Indicatore Chart UI Tools Key Levels, image 10
Trading product for TradeLens Indicatore Chart UI Tools Key Levels, image 11
Da 09/02/2026
29
Vendite
179
Installazioni gratuite

Descrizione

TRADELENS - MANTIENI IL CONTESTO. VEDI IL DETTAGLIO.

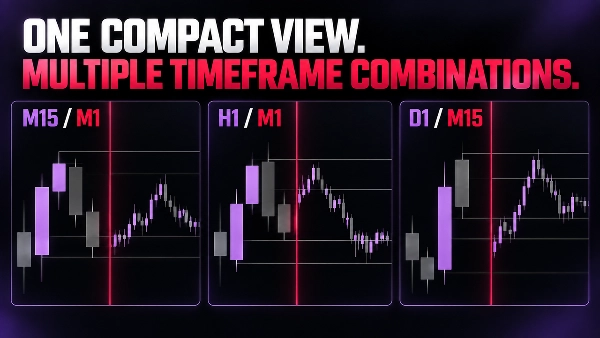
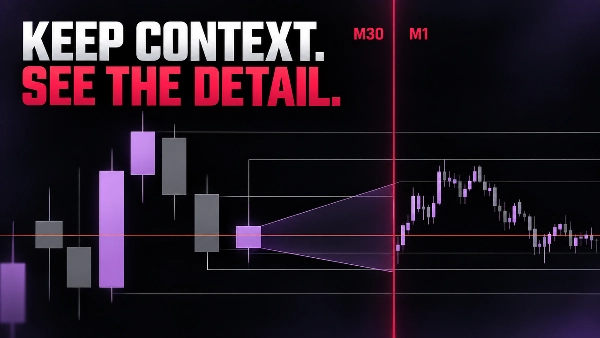
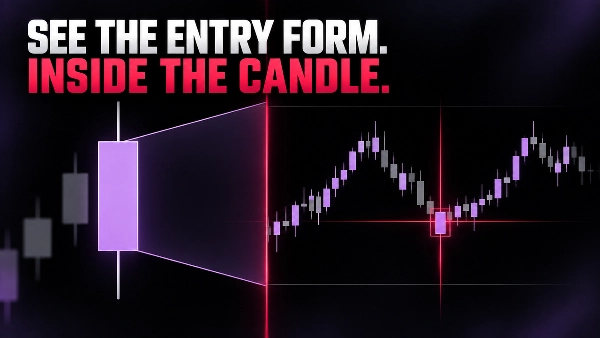
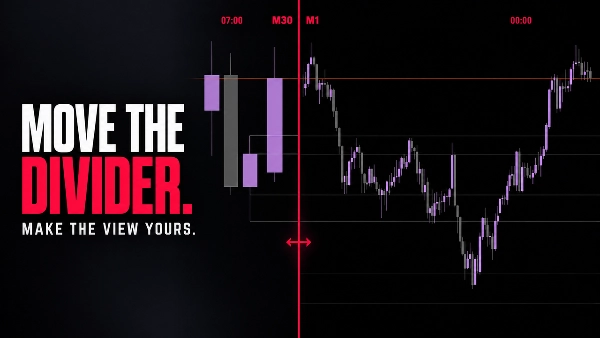
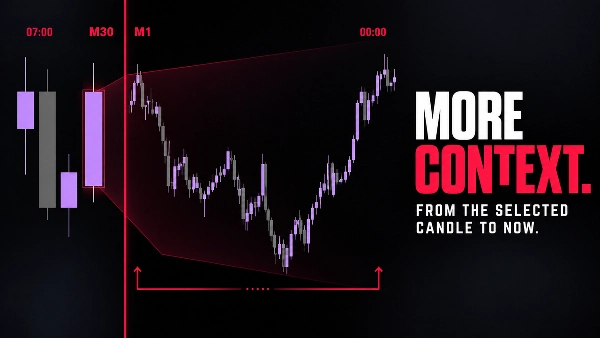
TradeLens posiziona una vista compatta delle candele a timeframe inferiore direttamente all'interno del tuo grafico attuale. Il grafico originale rimane il tuo contesto a timeframe superiore; il pannello dei dettagli mostra come il prezzo si sta sviluppando all'interno della candela di contesto selezionata.

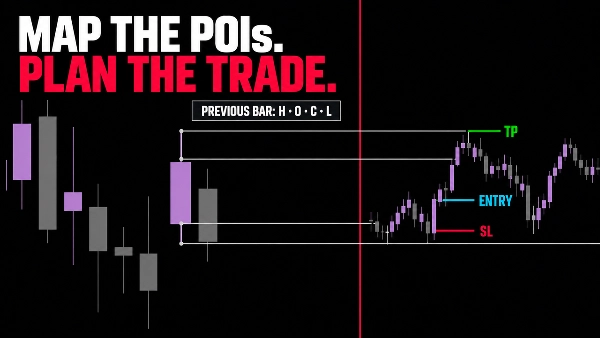
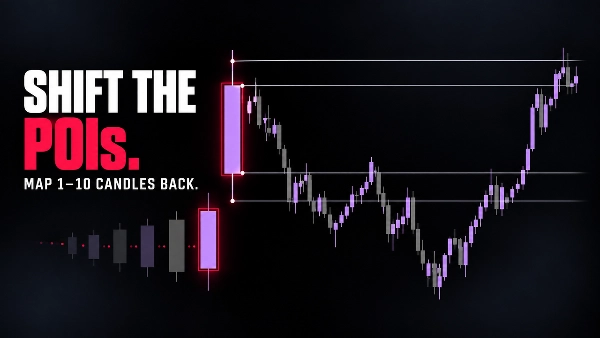
Usa per default la candela attualmente in formazione, oppure spostati indietro per ispezionare una candela di contesto precedente. Puoi incorniciare l'impostazione attiva con POI opzionali (raggi) al massimo, minimo, apertura e chiusura della barra chiusa precedente, quindi studiare il movimento a timeframe inferiore senza uscire dal grafico.

COS'È CHE TRADELENS TI AIUTA A VEDERE

  • Struttura a timeframe superiore e dettaglio a timeframe inferiore nella stessa finestra.
  • La progressione della candela di contesto corrente a una scala più fine.
  • Punti di interesse OHLC della barra precedente su tutto il grafico.
  • Combinazioni compatte come M15/M1, M30/M1, H1/M1, D1/M15 e D1/M30.
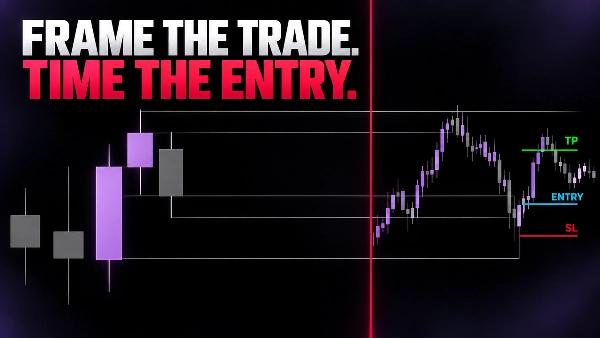
  • Un modo più pulito per affinare il timing di ingresso preservando il contesto.
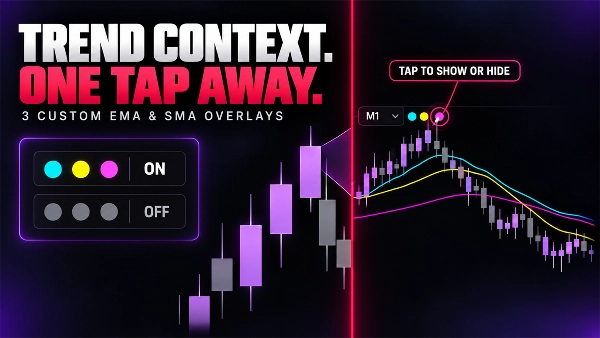
  • Aggiungi fino a tre sovrapposizioni personalizzabili di EMA o SMA.
  • Mostra o nascondi ogni media istantaneamente con controlli a un tocco.
  • Vedi la direzione del trend direttamente all'interno della vista a timeframe inferiore.

CONTROLLI SEMPLICI E VISIVI

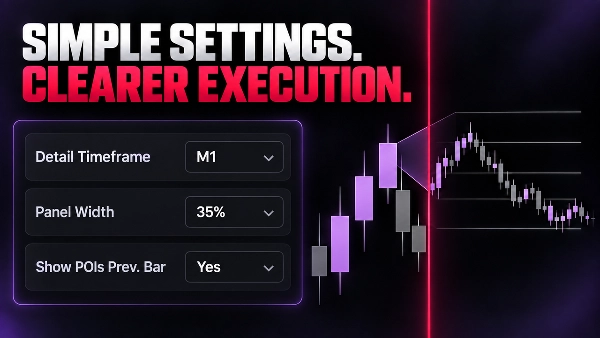
  • Timeframe del dettaglio e spostamento della candela di contesto.
  • Larghezza del pannello dei dettagli, sfondo e opacità.
  • Colori per toro, orso, separatore ed etichetta.
  • POI opzionali della barra precedente con colore e spessore configurabili.

Il timeframe del dettaglio deve essere inferiore a quello del grafico. Se la combinazione non è valida, TradeLens nasconde la sua visualizzazione e mostra un banner di configurazione chiaro.

TradeLens è uno strumento di analisi visiva. Non piazza, modifica o gestisce ordini. Gli esempi mostrati nella galleria illustrano un flusso di lavoro di lettura del grafico e non sono raccomandazioni di trading né garanzie di performance.


Riepilogo

Riepilogo AI
TradeLens is a chart visualization tool designed to integrate two timeframes within a single trading chart. It embeds a compact lower-timeframe candle view inside the current higher-timeframe chart, allowing traders to observe detailed price action within the context of a broader market structure. Users can analyze the progression of the current or previous context candles at a finer scale without switching charts.

Key features include optional points of interest (POIs) marking the previous bar’s Open, High, Low, and Close levels, customizable visual settings such as detail panel size, background opacity, and color schemes for bullish, bearish, and separator elements. TradeLens supports common timeframe combinations like M15/M1, M30/M1, H1/M1, D1/M15, and D1/M30, ensuring the detail timeframe is always smaller than the context timeframe.

This tool facilitates refined entry timing by preserving higher-timeframe context while providing granular lower-timeframe insights. It is a visual analysis indicator and does not execute or manage trades. TradeLens is tagged under market structure and chart UI tools, supporting analysis related to key levels, liquidity sweeps, market structure changes, and inducements.
Profilo indicatore
Categoria indicatore
Struttura del mercato (SMC)
Tipo di output
Visualizzazione
Requisiti per i dati
Solo barre

Discussioni

Recensioni dei clienti

4.5
Recensioni: 4
5
50 %
4
50 %
3
0 %
2
0 %
1
0 %
Recensioni dei clienti
October 24, 2026
smaller candles inside the larger one are an elegant way to retain the path within the wider move, with optional previous OHLC giving the comparison useful reference points instead of adding entry signals.
October 8, 2026
M1 candles inside an H1 candle keep the little moves and the bigger picture together. Previous OHLC can be added when needed. A handy comparison overlay, with the detail period required to stay smaller than the context period.
October 4, 2026
TradeLens displayed an embedded M1 candle view on EURUSD H1 and XAUUSD H1, M10 and Month1. Three moving averages, timeframe labels and the separator were visible. The invalid M1/M1 combination correctly triggered a clear warning. The interface works well, although low contrast and compressed detail candles can affect readability, especially on higher timeframes.
October 2, 2026
keeping M1 detail inside H1 context is a useful comparison view, with optional previous OHLC references and a clear requirement for the detail period to remain smaller than the larger candle.

Domande frequenti
Chart UI Tools
Key Levels
Liquidity Sweep
CHOCH
Inducement
Market Structure
Liquidity Grab
I prodotti disponibili tramite cTrader Store, inclusi bot di trading, indicatori e plugin, sono forniti da sviluppatori terzi e resi disponibili esclusivamente a scopo informativo e di accesso tecnico. cTrader Store non è un broker e non fornisce consulenze in materia di investimento, raccomandazioni individualizzate o garanzie di risultati futuri.

Altro da questo autore

Indicatore
BOS
CHOCH
+5
Spot market structure shift with ease, overlay timeframes, avoid false breakouts with open close pivots, hide chart bars
Indicatore
Volume
Imbalance
+5
Spot Institutional Order Flow with Proportional Volume Bubbles & Integrated Cumulative Volume Delta (CVD) Intelligence.
Indicatore
Forex
EURUSD
+5
Fimathe Indicator - Fimathe PCM - Automated Trend Channels & Levels — Ideal for live trading and backteting
Logo di "ZigXRay"
Più votato
4.6
(5)
$29
/
$49
Indicatore
CHOCH
Key Levels
+5
ZigZag Market Structure Identifier - Multi-Layer Scanner: Convergent Pivot Detection, 4-TF Overlay & Naked Chart Mode.
Plugin per desktop
Risk/Reward
Trade Journal
+5
cTrader Journal - Automatic Trade Capture. Offline Reviews. No Subscription.
Indicatore
Key Levels
Break & Retest
+5
Premium Discount Levels - Professional Dealing Range Zones with Draggable Lines, Alerts, Wartermark & Backtest Mode.
cBot
Fixed Lot
TP Manager
+5
Hotkeys Trading Assistant - Professional Shortcut Assitant with Risk Manager, Hotkeys & Lot Sizing.
Indicatore
Key Levels
Order Block
+5
FVG Levels — Auto-Detection of Multi-Timeframe Fair Value Gaps & GAPs, Smart Filters and Liquidity Zone Monitoring

Potrebbe interessarti anche

Indicatore
Fibonacci
Key Levels
+1
Explore Elliott wave counts, three swing sizes and example levels with an interactive cTrader chart panel.
Indicatore
AI
ATR
+20
Buy and Sell Signals
Indicatore
SMC
Prop
+15
Auto-detects Swing Highs/Lows to draw dynamic Support & Resistance levels with break tracking.
Indicatore
Prop
Forex
+11
⚡Nebula Range Filter is a professional trend filter indicator for cTrader⚡
Indicatore
Prop
Forex
+5
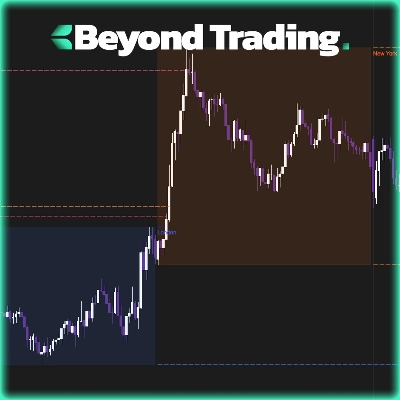
Tracks NY, London, Tokyo, Sydney sessions with custom visuals, and a real-time expanding range box and breakout High/Low
Indicatore
ATR
Forex
+5
A powerful ATR-based indicator generating clear BUY/SELL signals. Features real-time alerts and customizable sensitivity
Indicatore
Signal
Trades Opening Range Breakouts Indicator with dynamic stops/targets adapting to market volatility.
Indicatore
Forex
BTCUSD
+11
Next-gen Volume Oscillator using Hyperbolic Tangent math. No repainting. Includes arrows, alerts, and overlay mode 🎯
Indicatore
RSI
Signal
+2
Dynamic circles visualize price's volatility position. Like RSI for market overextension & stretch. Quantify context.
Indicatore
VWAP
Support & Resistance
Trading.FC$_vwap Algo shows VWAP trends, dynamic support/resistance and deviation bands to spot potential trade entries.
Indicatore
AI
Prop
+14
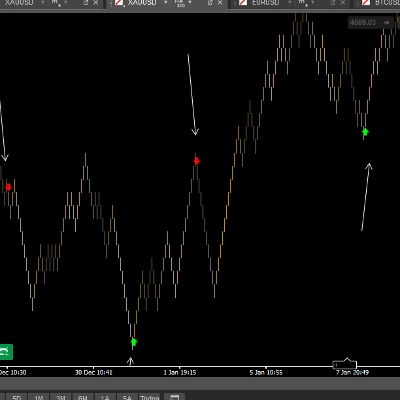
Professional Trading Indicator Transform Your Trading with Intelligent Signal Detection RenkoProfit
Indicatore
Forex
BTCUSD
+11
Unlock trading precision with QQE! Dual QQE indicators with a Bollinger Bands zero line provide clear buy/sell signals.
Indicatore
Key Levels
Trend-filtered signals, transparent trade plans and a multi-timeframe decision panel for cTrader.
Indicatore
Forex
Crypto
+3
Perfect Trend
Indicatore
AI
ATR
+26
MacD Custom Indicator-Multiple Time Frame
Indicatore
ATR
MACD
+15
BrickAlgo TrendPulse is an advanced technical analysis tool that combines multiple indicators with filterin mechanisms.
Indicatore
RSI
VWAP
+5
Trend direction, chart signals, reversal zones and volume tools in one configurable indicator.
Indicatore
BOS
EMA
+5
Market structure signals graded A to C, each with a drawn trade plan, plus an adaptive trend ribbon and a trend matrix

Prezzo

Da 09/02/2026
29
Vendite
179
Installazioni gratuite