MAMA CANDLES
Indicatore
Versione 1.0, Sep 2024
Windows, Mac
4.5
Recensioni: 2
Descrizione
Questo codice implementa l'Indicatore MESA Adaptive Moving Average (MAMA) indicatore, un filtro adattivo complesso progettato per rispondere ai cicli e smussare i dati dei prezzi. Ecco una panoramica delle sue caratteristiche principali:
Elementi chiave:
- Trasformata di Hilbert: L'indicatore utilizza una Trasformata di Hilbert per calcolare la fase e il periodo del ciclo dominante della serie dei prezzi, che aiuta a identificare il ciclo di mercato.
- MAMA e FAMA adattivi:
-
- MAMA è la media mobile più veloce che si adatta al ciclo dominante.
- FAMA è la media più liscia e più lenta.
- Entrambe sono tracciate sul grafico usando colori diversi.
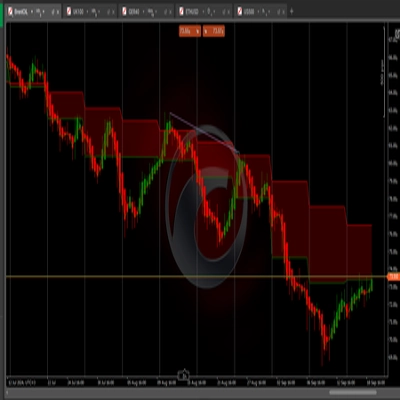
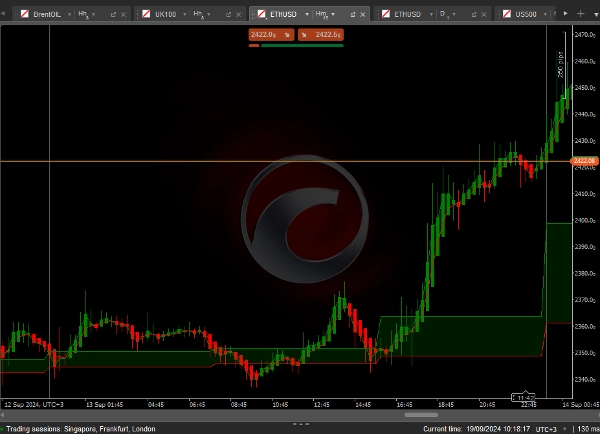
- Colorazione personalizzata delle candele:
-
- Le candele sono colorate di verde quando MAMA è sopra FAMA (condizione rialzista).
- Sono colorate di rosso quando MAMA è sotto FAMA (condizione ribassista).
Riepilogo
Profilo indicatore
Recensioni dei clienti
4.5
Recensioni: 2
5 | 50 % | |
4 | 50 % | |
3 | 0 % | |
2 | 0 % | |
1 | 0 % |
Discussioni
Domande frequenti
I prodotti disponibili tramite cTrader Store, inclusi bot di trading, indicatori e plugin, sono forniti da sviluppatori terzi e resi disponibili esclusivamente a scopo informativo e di accesso tecnico. cTrader Store non è un broker e non fornisce consulenze in materia di investimento, raccomandazioni individualizzate o garanzie di risultati futuri.
Altro da questo autore


Prezzo
Da 19/09/2024
314.61K
Volume negoziato
258.47K
Profitto in pip
536
Installazioni gratuite