present
Inscrivez-vous et bénéficiez d'une remise de 50 $ sur votre premier achat
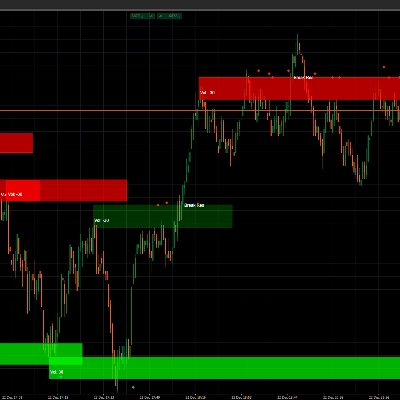
Trading product for AsianRange indikator Indicateur Key Levels Market Structure, image 1
AsianRange indikator
Indicateur
Version 1.0, Jul 2026
Windows, Mac
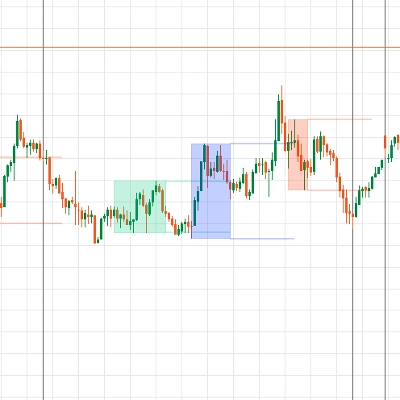
Trading product for AsianRange indikator Indicateur Key Levels Market Structure, image 2
Trading product for AsianRange indikator Indicateur Key Levels Market Structure, image 3
Depuis le 19/09/2025

Description

WHAT DOES IT DO?

--------------------------------------------------------

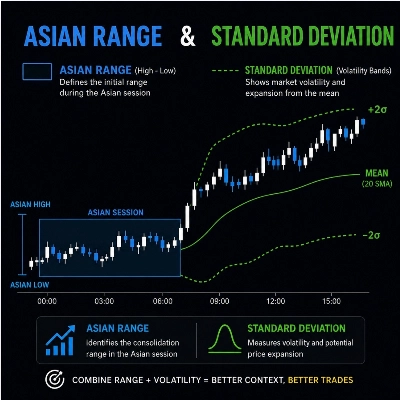
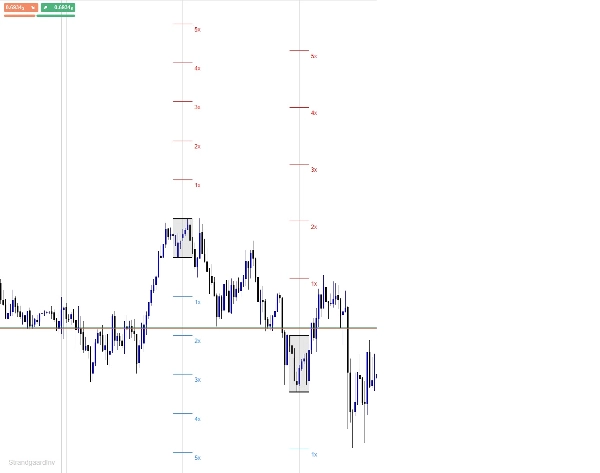
The indicator draws the range from 8PM to 12AM

for each day for a rolling number of days back ("Days Back"),

including today (live).


For each day, it draws:

- A filled box marking the range itself (high/low)

- A horizontal line at the top of the range

- A horizontal line at the bottom of the range

- Standard deviation lines (1x to 5x, number adjustable)

above and below the range, limited to the same time width

as the range itself (not projected to the right)


Everything for a given day is automatically cleared away again when the day

falls outside your chosen "Days Back" window.


--------------------------------------------------------

IMPORTANT: TIME ZONE / DST

----------------------------------------------------------------

The start and end time of the range (default 8 PM - 12 AM)

is entered in YOUR BROKER'S SERVER TIME - not automatically in EST.


The indicator does NOT convert between EST/EDT and your

broker's server time. This means:


1. You have to find out what 20:00-00:00 EST

corresponds to on your broker's server clock (e.g. check a known

news time against your chart).


2. When the USA switches to/from daylight saving time (DST), or if

your broker's server does not follow DST,

the difference changes - then you have to update the Start/End

Hour parameters in the indicator yourself.


Standard Range window: 8:00 PM - 12:00 AM EST.


-----------------------------------------------------

PARAMETERS

----------------------------------------------------------

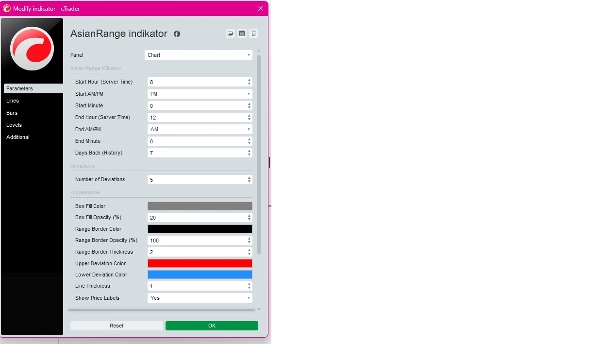
8pm-12am Range Window:

Start Hour / Start AM-PM / Start Minute - start of the range (server time)

End Hour / End AM-PM / End Minute - end of the range (server time)

Days Back (History) - how many days back

are shown (0 = today only)

Deviations:

Number of Deviations - number of SD levels (1-10),

default 5

Appearance:

Box Fill Color / Box Fill Opacity (%) - color and transparency

for the range box itself

Range Border Color / Range Border Opacity - color and transparency

/ Range Border Thickness for the top/bottom lines

Upper Deviation Color - color for SD lines above the range

Lower Deviation Color - color for SD lines below the range

Line Thickness - thickness of SD lines

Show Price Labels - show/hide "1x", "2x" etc.

next to the SD lines

----------------------------------------------------------------------

KNOWN PITCH

------------------------------------------------------

If the top/bottom lines (Range Border Color) are set to a color that matches your chart background (e.g. white line on white background), they will look like they are "not being drawn" - they just lie there invisibly. Default is set to black, which suits a light/white chart theme. Change to a lighter color if you are using a dark theme.


--------------------------------------------------------

INSTALLATION

---------------------------------------------------------

1. Open cTrader -> Automate tab.

2. Create a new Indicator (or open an existing one).

3. Replace the code with the contents of the.cs file

4. Build.

5. Add the indicator to your chart via "Add algorithm".


--------------------------------------------------------

Résumé

Profil de l'indicateur
Catégorie de l'indicateur
Structure du marché (SMC)
Type de résultat
Visualisation
Exigences en matière de données
Barres seulement
Signaux pris en charge
Écart d'ouverture de session

Discussion

Avis clients

0.0
Avis : 0
Avis clients
Il n'y a pas encore d'avis sur ce produit. Vous l'avez déjà essayé ? Soyez le premier à en parler aux autres !

Questions fréquentes

Key Levels
Market Structure
Les produits disponibles sur cTrader Store, notamment les bots de trading, les indicateurs et les plug-ins, sont fournis par des développeurs tiers et mis à disposition à titre informatif et à des fins d'accès technique uniquement. cTrader Store n'est pas un courtier et ne fournit aucun conseil en investissement, aucune recommandation personnelle ni aucune garantie quant aux performances futures.

Vous pourriez aussi aimer

Indicateur
Smoothed CCI alerts! Audio & arrow signals for +/-100 crosses. Custom sounds & arrow filters. Precision trading!
Indicateur
Drawdown Monitor
Protect your funded account. Real-time Daily Equity Drawdown monitor with Green / Orange / Red flashing alerts.
Indicateur
AI
ATR
+27
Support and Resistance with signals
Indicateur
Highlights market sessions & overlaps with real-time range & volume stats – perfect for pro scalpers.
Indicateur
EMA
RSI
+5
MACD Colour Histogram with 11 Moving Average Types, Multi-timeframe confirmation and Sound Signal Alert.
Indicateur
ATR
MSS
+5
Advanced market structure and institutional cycle mapper with visual reference cards and entry alerts
Logo de "TrendMagicOptimized"
Les mieux notés
4.5
(4)
$19
/
$20
Indicateur
Clean trend indicator using CCI & ATR. Highlights up/down trends with adaptive, no-repaint lines.
Indicateur
RSI
MACD
+1
Precision Supply & Demand zones indicator—automatically plots key buy/sell areas on your chart for smarter entries.
Indicateur
Prop
Forex
+14
Stochastic Momentum Index (SMI) for cTrader optional higher-timeframe source, and clear overbought/oversold levels.
Indicateur
SMC
Prop
+4
📈 Trading Sessions Indicator — London, New York & Tokyo Visualize Key Market Sessions + High/Low Levels with Precision
Indicateur
AI
ATR
+20
Detects smart money activity using advanced tick volume and price divergence analysis.
Indicateur
Prop
Forex
+7
The Parabolic SAR, or "Stop and Reverse," is a dynamic technical analysis tool.
Indicateur
SMC
Forex
+5
The only cTrader FVG indicator with Breakaway Gap detection, mitigation tracking, and full multi-asset compatibility.
Indicateur
Laser entries with pivot confirmation. No repaint, all timeframes. Professional results.
Indicateur
AI
SMC
+5
Coloring trendline/ Colored Trendline / Color Trendline
Indicateur
EMA
Supertrend
+4
Dynamic dual MA cloud indicator. Identifies trends, crossovers, and pullback entries in real time for any asset.
Indicateur
Prop
Forex
+5
🎯 Order Block Detector - Smart Trading: Identifica bloques de órdenes clave en cTrader para un trading más inteligente.
Indicateur
Doji
Volume
+5
Instantly spot high-liquidity institutional moves with clean, non-obtrusive triangle alerts on cTrader charts.

Prix

Depuis le 19/09/2025