
Descrizione
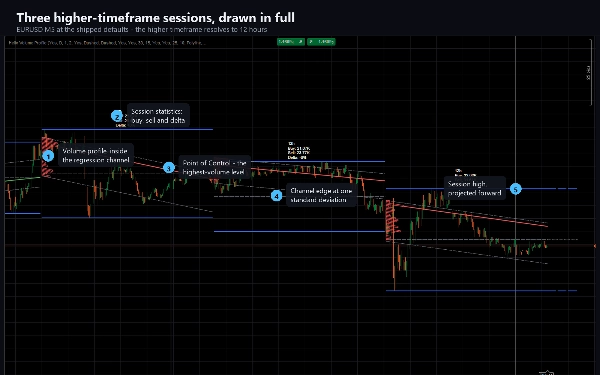
Helix Volume Profile costruisce un quadro completo della sessione a timeframe superiore in cui si trova il grafico corrente.
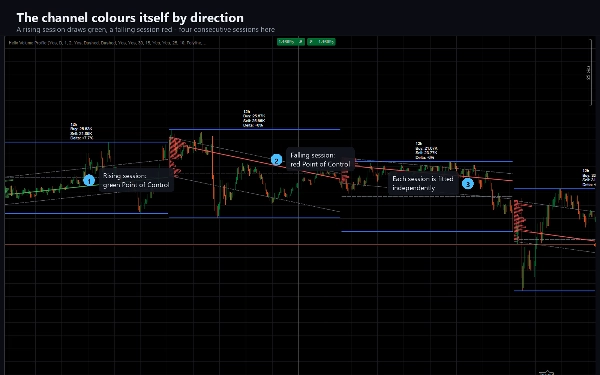
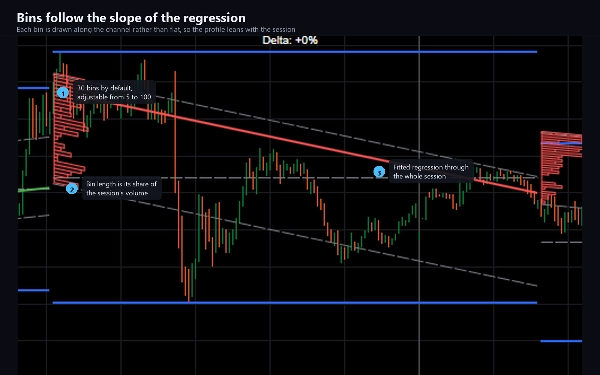
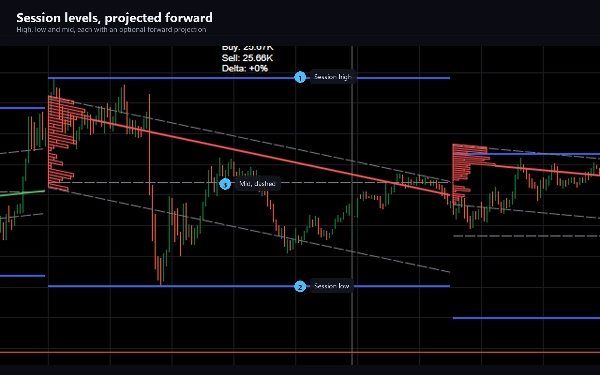
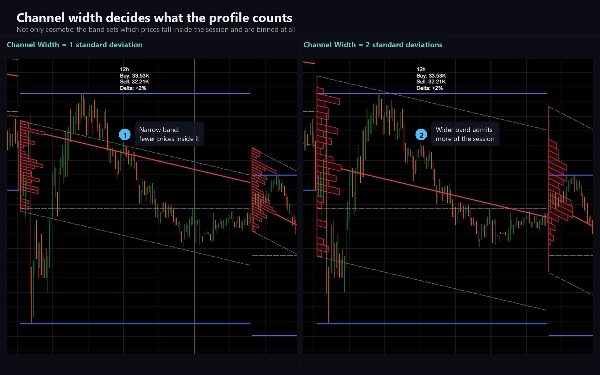
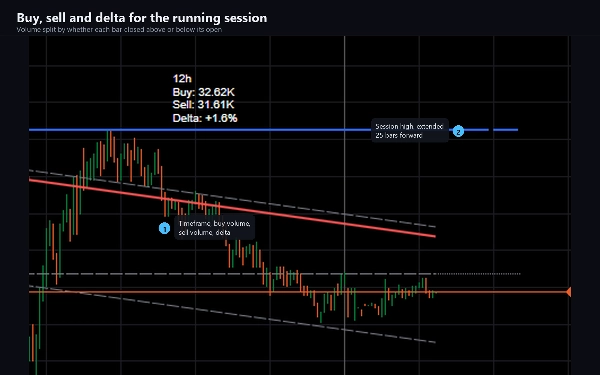
Per ogni sessione adatta una regressione logaritmica su ogni barra finora, disegna un canale largo un numero configurabile di deviazioni standard attorno ad essa e riempie quel canale con un profilo di volume i cui bin seguono la pendenza della regressione invece di essere piatti. Il bin con il volume più alto è segnato con una linea Point of Control, colorata in base alla direzione in cui si muove il canale. I livelli high, low e mid della sessione sono disegnati accanto e possono essere proiettati in avanti, e un'etichetta compatta riporta il volume di acquisto, il volume di vendita e il delta tra di essi.
Il timeframe superiore è scelto per te di default e si adatta al grafico: una sessione di 12 ore su M5, quattro ore su M1, due giorni su M15, una settimana su H1, un mese su H4. Puoi disattivarlo e impostare la sessione tu stesso - minuti, giorni, settimane o mesi sono tutti accettati.
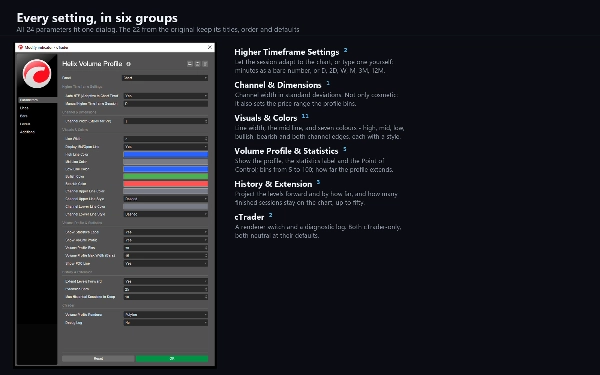
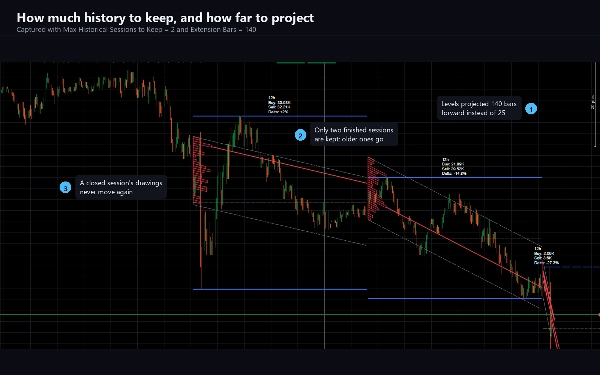
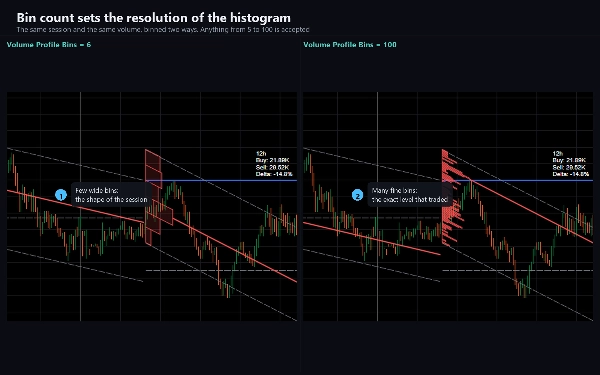
Tutto è regolabile. Larghezza del canale, il numero di bin del profilo da 5 a 100, quanto il profilo si estende, se il Point of Control, l'etichetta delle statistiche e le proiezioni in avanti sono mostrati, le larghezze e gli stili delle linee, sette colori e quante sessioni concluse rimangono sul grafico, fino a cinquanta.
A COSA SERVE
Leggere dove il prezzo si trova all'interno della sua struttura a timeframe superiore senza uscire dal tuo timeframe di lavoro. Il canale mostra la deriva e la dispersione della sessione; il profilo mostra dove il volume si è effettivamente accumulato al suo interno; il Point of Control segna il livello che ha visto la maggior attività. I trader li usano per definire supporti e resistenze, per giudicare se un movimento è esteso rispetto alla sessione e per vedere se ha dominato l'acquisto o la vendita.
Adatto a qualsiasi strumento e qualsiasi timeframe. È più informativo sui grafici intraday da M1 a H4, dove la sessione adattiva offre una finestra significativa; su Daily e superiori, imposta la sessione manualmente.
COME SI COMPORTA
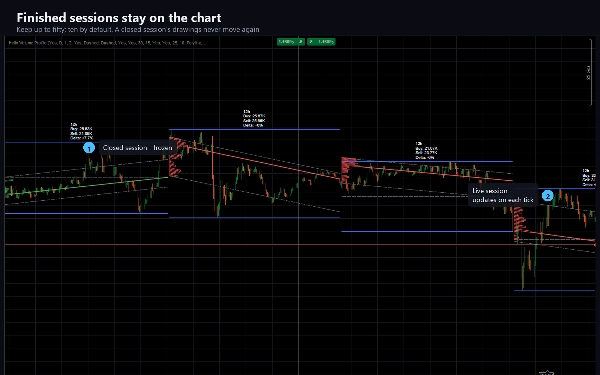
La sessione live si aggiorna ad ogni tick e i suoi disegni si muovono fino alla chiusura della sessione - il canale viene riadattato, il profilo ricostruito e i livelli ricalcolati ad ogni arrivo di una barra. Una volta che una sessione termina, i suoi disegni sono congelati e non cambiano più. Questo è voluto ed è il modo in cui funziona il metodo; se hai bisogno di livelli che non si muovono intrabar, leggi una sessione chiusa piuttosto che quella live.
Il volume su un simbolo forex è il conteggio tick che il tuo broker riporta, quindi il profilo riflette il tuo feed personale.
TECNICO
Indicatore, overlay. 24 parametri. Nessun permesso di trading, nessun accesso a file e nessun accesso alla rete - è costruito con AccessRights impostato su None e non può piazzare ordini. Include un'edizione di prova limitata a EURUSD senza limiti di tempo e senza funzionalità disabilitate.
La documentazione copre l'installazione, ogni parametro con il suo scopo e una guida alla risoluzione dei problemi che spiega ogni comportamento che sorprende gli utenti.
Il trading comporta rischi. Le performance passate non garantiscono risultati futuri.
Riepilogo
The higher timeframe session adapts automatically based on the chart timeframe (e.g., 12 hours on M5, one week on H1) but can be manually set to minutes, days, weeks, or months. Users can customize channel width, number of volume bins (5 to 100), profile extension, visibility of elements, colors, line styles, and how many past sessions remain visible (up to 50).
The live session updates on every tick, recalculating the channel and volume profile until session close, after which the data is fixed. Volume data reflects the broker's tick count for forex symbols. Helix Volume Profile is suitable for any instrument and timeframe, with particular utility on intraday charts from M1 to H4. It includes 24 adjustable parameters and operates without trading permissions or network access.
Discussioni
Recensioni dei clienti
5 | 0 % | |
4 | 100 % | |
3 | 0 % | |
2 | 0 % | |
1 | 0 % |