present
Registrati e ricevi uno sconto da $50 sul tuo primo acquisto
Trading product for Momentum Tidebreaker Indicatore EMA Key Levels, image 1
Momentum Tidebreaker
Indicatore
Versione 1.0, Sep 2026
Windows, Mac
Trading product for Momentum Tidebreaker Indicatore EMA Key Levels, image 2
Trading product for Momentum Tidebreaker Indicatore EMA Key Levels, image 3
Trading product for Momentum Tidebreaker Indicatore EMA Key Levels, image 4
Trading product for Momentum Tidebreaker Indicatore EMA Key Levels, image 5
Trading product for Momentum Tidebreaker Indicatore EMA Key Levels, image 6
Trading product for Momentum Tidebreaker Indicatore EMA Key Levels, image 7
Trading product for Momentum Tidebreaker Indicatore EMA Key Levels, image 8
Trading product for Momentum Tidebreaker Indicatore EMA Key Levels, image 9
Trading product for Momentum Tidebreaker Indicatore EMA Key Levels, image 10
Trading product for Momentum Tidebreaker Indicatore EMA Key Levels, image 11
15
Vendite
308
Installazioni gratuite

Descrizione

MOMENTUM TIDEBREAKER

Un indicatore di trend e momentum che genera segnali da tre famiglie indipendenti, traccia i livelli di trading per ciascuna e li segue fino al loro esito su una dashboard a 16 righe.

COSA INSERISCE SUL TUO GRAFICO

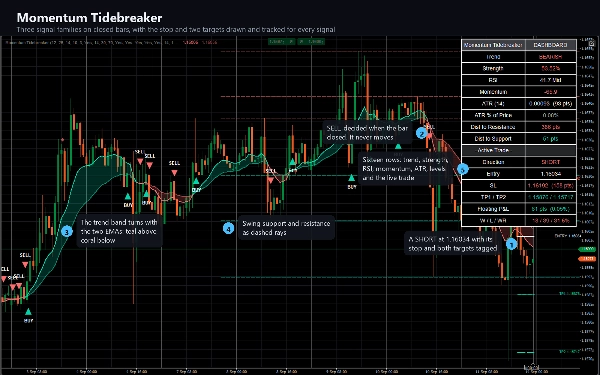
  • Una EMA veloce e una lenta, colorate in base al trend, con una banda traslucida tra di esse che diventa rialzista o ribassista con il trend.
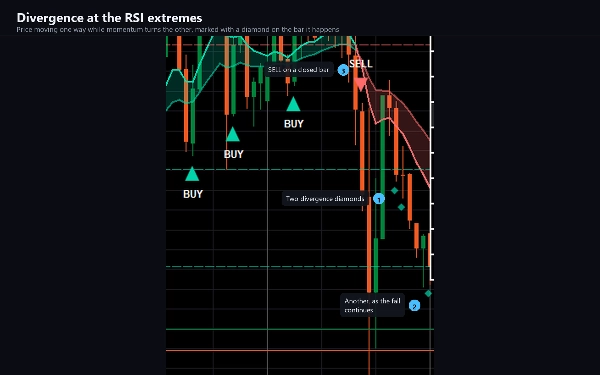
  • Indicatori BUY e SELL, indicatori STRONG più grandi dove un segnale coincide con una divergenza di momentum, e un piccolo diamante su ogni barra di divergenza.
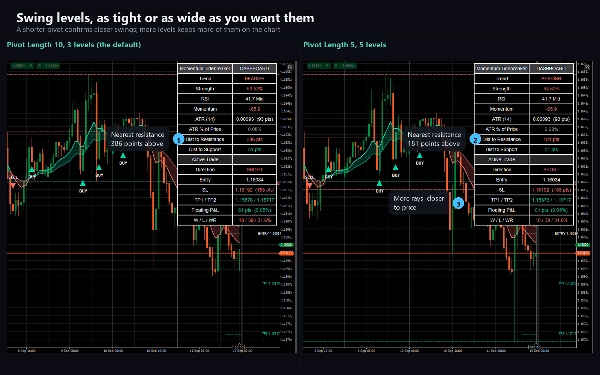
  • Livelli di supporto e resistenza swing disegnati come raggi tratteggiati, fino a cinque per lato.
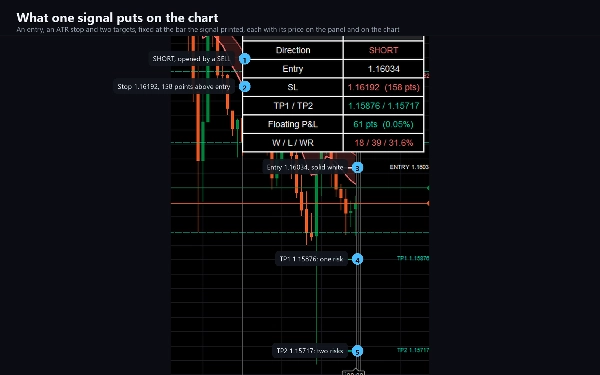
  • Per ogni segnale: una linea di ingresso, uno stop e due target, ciascuno etichettato con il suo prezzo.
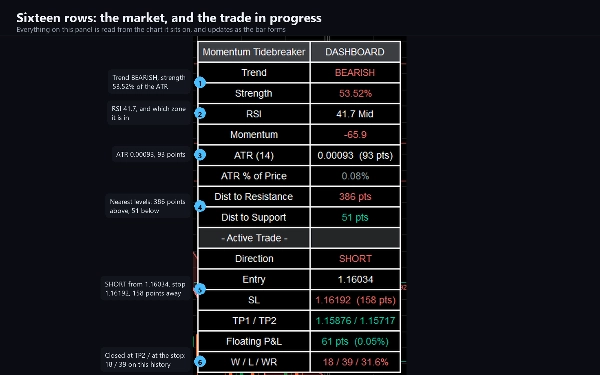
  • Una dashboard nell’angolo: trend, forza del trend, RSI e la sua zona, momentum, ATR in prezzo, tick e percentuale, la distanza dalla resistenza e supporto più vicini, e il trade attivo con ingresso, stop, target, risultato flottante e un conteggio vittorie/sconfitte.

TRE FAMIGLIE DI SEGNALI, TUTTE SU BARRE CHIUSE

  1. Trend Cross - la EMA veloce incrocia la EMA lenta, confermato dall’RSI sul lato destro di 50, una forza del trend superiore all’1% della volatilità e, opzionalmente, un momentum a 5 barre che punta nella stessa direzione.
  2. RSI Reclaim - l’RSI attraversa 50 nella direzione del trend EMA mentre il prezzo mantiene il lato giusto della EMA lenta.
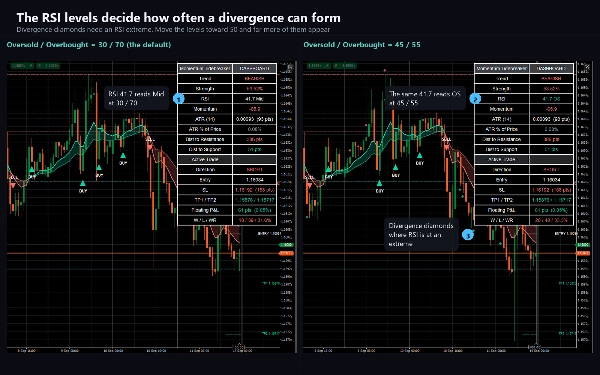
  3. Divergenza - il prezzo continua a scendere mentre il momentum si alza su un RSI ipervenduto (lo specchio su ipercomprato), con la chiusura che torna oltre la EMA veloce.

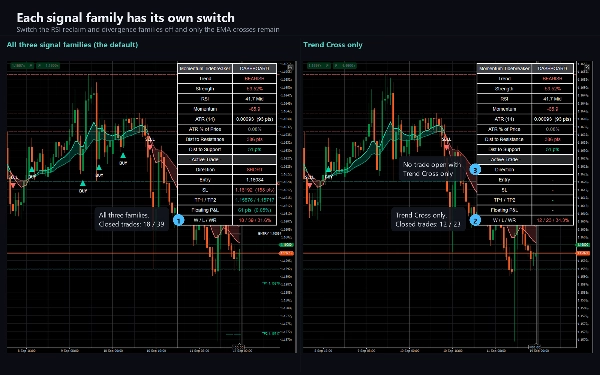
Ogni famiglia ha il proprio interruttore. Ogni segnale viene deciso alla chiusura della barra e non si sposta più.

STOP E TARGET

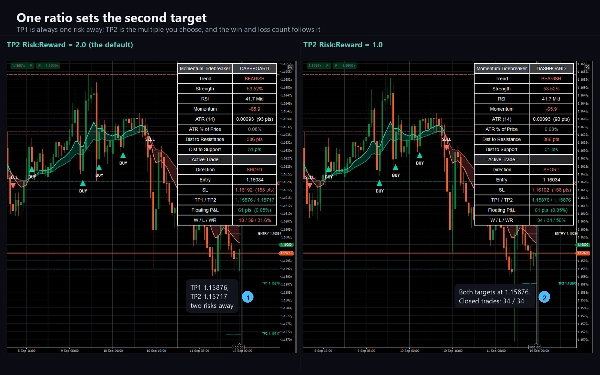
Lo stop si posiziona a un numero scelto di ATR dalla chiusura della barra del segnale. TP1 è a un rischio di distanza e TP2 è il multiplo rischio/ricompensa che imposti. Ad ogni barra successiva i livelli vengono controllati in ordine fisso - TP2, poi TP1, poi lo stop - e la dashboard mostra quale è stato raggiunto, con TP1 segnato una volta che è stato preso.

ALLARMI

Nove eventi, ciascuno con il proprio interruttore: BUY, SELL, STRONG BUY, STRONG SELL, TP1, TP2, stop, divergenza rialzista e divergenza ribassista. Ognuno va nel log di cTrader, un suono o una e-mail, una volta per barra chiusa.

IMPOSTAZIONI CHIAVE

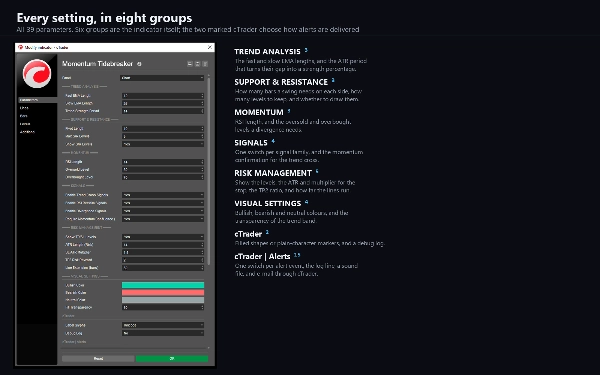
Lunghezze EMA veloce e lenta, periodo forza trend, lunghezza pivot e numero di livelli, lunghezza RSI con livelli ipervenduto e ipercomprato, i tre interruttori di famiglia e la conferma momentum, lunghezza ATR e moltiplicatore per lo stop, rischio/ricompensa TP2, quanto si estendono le linee di trade, e i colori rialzista, ribassista e neutro con la trasparenza della banda. Trentanove parametri, tutti documentati.

TIPO DI INDICATORE E FINESTRA

Un indicatore overlay: disegna sul grafico dei prezzi, non in un pannello separato. Legge solo le barre del grafico stesso.

TIMEFRAME E STRUMENTI PREFERITI

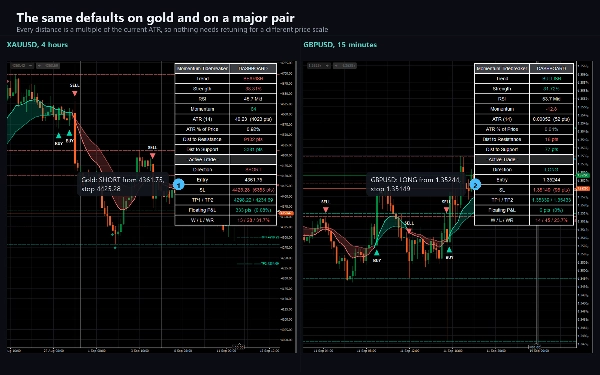
M15 a H1 è un punto di partenza equilibrato. H4 e D1 danno segnali meno frequenti e più lenti e livelli che tengono per giorni; M1 e M5 danno molti più segnali. Costruito e verificato su EURUSD e XAUUSD, e indipendente dal simbolo, quindi funziona su coppie forex, metalli, indici e criptovalute allo stesso modo.

A CHI È RIVOLTO

Trader che combinano la direzione del trend con la conferma del momentum e vogliono che ingresso, stop e target siano tracciati e seguiti invece che misurati a mano, intraday o swing.

COSA NON È

Non è un sistema automatizzato. Non piazza ordini, non apre connessioni di rete e non legge file - non dichiara alcun diritto di accesso, come puoi verificare nei dettagli dell’algoritmo.

LA VERSIONE DI PROVA

La versione di prova è lo stesso prodotto limitato a EURUSD, con qualsiasi suffisso broker accettato. Non ha limiti di tempo e nulla è trattenuto. La versione completa aggiunge tutti gli altri simboli.

NOTE TECNICHE

cTrader Desktop 5.x. Segnali e linee di trade non si ridisegnano; la dashboard e i livelli di supporto e resistenza si aggiornano mentre una barra si forma. Un livello swing è confermato dopo Pivot Length barre dallo swing. cTrader mostra un margine a destra solo con Chart Shift abilitato, quindi le etichette di prezzo oltre l’ultima barra stanno appena all’interno del bordo destro.

SUPPORTO

Attraverso la scheda Discussione in questa pagina. Si prega di includere il broker, simbolo, timeframe, versione di cTrader e uno screenshot dell’intero grafico compresa la dashboard.

Il trading comporta rischi. Le performance passate non garantiscono risultati futuri.

Riepilogo

Riepilogo AI
Momentum Tidebreaker is a trend and momentum overlay indicator designed for use on price charts in cTrader Desktop 5.x. It integrates three independent signal families—EMA trend crosses, RSI reclaim, and momentum divergence—to generate buy and sell signals confirmed on closed bars. The indicator displays a fast and slow exponential moving average (EMA) colored by trend, with a translucent band indicating bullish or bearish conditions.

Key chart features include buy/sell markers, strong signal markers when momentum divergence coincides, swing support and resistance levels (up to five per side), and detailed trade levels for each signal: entry, stop loss (based on ATR multiples), and two profit targets with price labels. A 16-row dashboard provides real-time information on trend direction and strength, RSI status, momentum, ATR values, proximity to support/resistance, and active trade performance including floating results and win/loss counts.

Signals are generated based on EMA crosses confirmed by RSI and trend strength, RSI crossing 50 aligned with EMA trend, and price-momentum divergences at overbought/oversold RSI levels. Alerts can be configured for nine event types including signals, targets, stops, and divergences.

The indicator is symbol-agnostic, verified on EURUSD and XAUUSD, and suitable for multiple timeframes from M15 to daily. It is intended for traders combining trend and momentum analysis who prefer automated visualization of entries, stops, and targets without automated order execution.
Profilo indicatore
Categoria indicatore
Trend
Tipo di output
Segnali
Visualizzazione
Requisiti per i dati
Solo barre
Segnali supportati
Superamento
Divergenza
Forza del trend

Discussioni

Recensioni dei clienti

0.0
Recensioni: 0
Recensioni dei clienti
Questo prodotto non ha ancora ricevuto recensioni. L'hai già provato? Fallo sapere agli altri per primo!

Domande frequenti

EMA
Key Levels
RSI
ATR
Support & Resistance
I prodotti disponibili tramite cTrader Store, inclusi bot di trading, indicatori e plugin, sono forniti da sviluppatori terzi e resi disponibili esclusivamente a scopo informativo e di accesso tecnico. cTrader Store non è un broker e non fornisce consulenze in materia di investimento, raccomandazioni individualizzate o garanzie di risultati futuri.

Altro da questo autore

Indicatore
ATR
EMA
+3
EMA cross filtered by a trend average and its ATR channel, with long, short and close marks and colored candles.
Logo di "Bullion Horizon"
Statistiche in tempo reale
$97
/
$147
cBot
Balanced
Fixed Lot
+5
Gold grid cBot for XAUUSD H1: four-signal confluence on closed bars, ladders closed at a basket profit, news filter
15.6%
ROI
2.33
Fattore di profitto
Indicatore
ATR
CCI
+4
A trend line that never steps back, a shaded band to the price, and a pointer at the swing where the trend turns.
Indicatore
ADX
ATR
+5
EMA-cross signals scored on six confluence layers, with an ATR stop, three targets and a live panel
Indicatore
ATR
RSI
+5
Fusion trend line with a layered cloud, BULL and BEAR labels, scored re-entry triangles and exit markers.
Indicatore
ATR
RSI
+4
RSI bands drawn on price, confluence-scored BUY/SELL signals, an ATR stop with three targets
Indicatore
ATR
RSI
+4
Adaptive Ichimoku with nine-factor confluence scoring, five signal types, smart TP/SL and an MTF panel.
Indicatore
ADX
ATR
+5
Ten confluence layers scored on every closed bar, with an anti-chop gate, pivot levels and a live dashboard.
Indicatore
ADX
ATR
+5
SuperTrend signals scored on five confluence factors, with an ATR stop, three targets and a dashboard.
Logo di "QuotientDrift"
Statistiche in tempo reale
$97
/
$147
cBot
TP Manager
Break Even
+5
Gold cBot for prop-firm accounts: pick your firm, phase and size; risk is sized from the firm's rules, its limits kept
1.6
Fattore di profitto
Indicatore
ATR
EMA
+2
Eight-EMA ribbon with ATR trade zones, a nine-symbol screener and a five-timeframe trend dashboard.
Indicatore
ATR
Volume
+3
Fibonacci trend signals on closed bars, with an ATR stop, up to four targets and a break-even ladder.

Potrebbe interessarti anche

Indicatore
AI
Forex
+5
Dynamic, color‑coded candles reveal market shifts instantly—spot momentum and trend reversals at a glance
Indicatore
ATR
MSS
+5
Advanced market structure and institutional cycle mapper with visual reference cards and entry alerts
Indicatore
ADX
ATR
+5
Signal Quality Score - 0-100 filter combining RSI, Volume, ATR, Trend Strength & Alignment. Works on ANY chart type.
Indicatore
Forex
Detects valid Fair Value Gaps from strong 3-bar patterns. Keep drawing unfilled gaps until price fills them.
Indicatore
VWAP
Volume
+5
Multi VWAP. Three timeframes. One clean chart. Your Essential Trading Tool.
Indicatore
ATR
RSI
+17
Turn data into precision trades with AlphaTrend Pro Max — advanced trend, signal & structure analysis in one.
Indicatore
Market Structure
Support & Resistance
Auto-centers price when it moves beyond threshold. Adjustable zoom. Works on any chart type. Never lose price again.
Indicatore
ATR
Upgrade to ATR-RMA! Experience the precise ATR using Relative Moving Average for accurate volatility analysis in cTrader
Indicatore
ATR
Wedge
+2
Strong Supertrend Turn Market Movement into a Clear Map Market analysis
Indicatore
SMC
VWAP
+4
Killzone Session and key levels with VWAP – Precision Meets Price Action
Indicatore
RSI
Forex
+6
What Constance Brown did with the RSI was to input a momentum calculation within the RSI itself. This the Composite RSI.
Indicatore
Overlay HTF context on any chart: color bars by HTF and draw filled HTF bodies with optional High/Low lines.
Indicatore
Volume
Key Levels
View tick activity across a selected chart range with Point of Control, Value Area High and Value Area Low.
Indicatore
ADX
ATR
+2
GOLD SENTINEL v1.0 - A CANDLE-COLORING INDICATOR FOR GOLD.
Indicatore
EMA
Supertrend
+4
Dynamic dual MA cloud indicator. Identifies trends, crossovers, and pullback entries in real time for any asset.
Indicatore
Indices
Multi-Timeframe ADX Trend Dots & Arrows
Indicatore
AI
Grid
+17
Clean 3D, Sleek Candles for Trend Patterns.
Indicatore
Forex
Real-Time Candlestick Pattern Detection with Custom Alerts & Trend Analysis for cTrader

Prezzo

15
Vendite
308
Installazioni gratuite