



설명
요약
AI summary
The Divergency_withSourceCode indicator for cTrader is a customizable tool designed to detect divergences and trend continuation patterns using multiple oscillators and fractal analysis. It supports 12 oscillators, including Chande Momentum, RSI, MACD, and Stochastic, allowing users to select and adjust oscillator settings such as period, smoothing, signal line, and moving average type.
The indicator identifies regular divergences (price makes higher highs/lower lows while oscillator does not), hidden divergences (oscillator makes higher highs/lower lows while price does not), and correlation patterns where price and oscillator move together. It uses fractal detection to find significant highs and lows in the oscillator based on a configurable fractal period.
Visual outputs include color-coded trend lines and markers displayed both on the chart and in a separate indicator window below the chart. Signals are shown as arrows or colored dots indicating bullish, bearish, hidden divergence, and correlation signals. Reference levels at 30 (oversold), 50 (mid), and 70 (overbought) are included.
Users can customize divergence detection parameters such as lookback periods and bar validation ranges to tailor signal sensitivity. The indicator is suitable for versatile divergence analysis across different markets and timeframes. Full source code is included for further customization.
지표 프로필
고객 리뷰
0.0
리뷰: 0
고객 리뷰
이 상품에 대한 리뷰가 아직 없습니다. 이미 사용해 보셨나요? 다른 사람들에게 가장 먼저 소개해 주세요!
상담
자주 묻는 질문(FAQ)
Signal
RSI
ATR
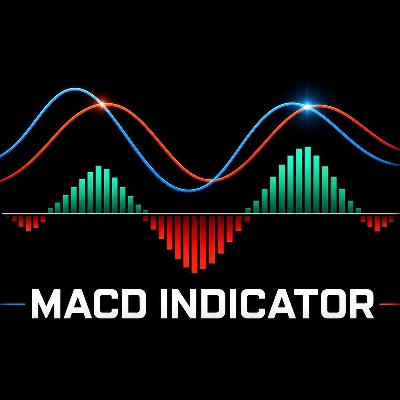
MACD
트레이딩 봇, 지표, 플러그인 등 cTrader Store에서 제공되는 상품은 제3자 개발자에 의해 제공되며, 이는 단순히 정보 및 기술적 접근을 목적으로 제공된 것입니다. cTrader Store는 중개인이 아니며, 투자 조언, 개인별 추천 또는 향후 성과에 대한 어떠한 보장도 제공하지 않습니다.






가격
가입일 11/01/2025
375
무료 설치