Descrizione
🚀 Oltre 10.000 trader utilizzano già i nostri MIGLIORI indicatori🏆
👉 Ottieni tutti i nostri MIGLIORI sistemi qui:
_______________________________________________
📌 Indicatori di Struttura di Mercato
· ✅ AdvancedMarket Structure: Bos, Choch, SwinLevels, Order Blocks, Market Structure& Liquidity Finder
· 🔄 Analisi Dinamica della Struttura di Mercato dei Punti di Inversione
· 🧱 Order Block
· ⛓️ BOS & CHOCH
· 🧠 ICT Power of 3
· 🌀 Zone di Polarità di Mercato
_______________________________________________
🔚 Sistemi di Uscita Intelligenti
· 📍 Algoritmo Intelligente di Trailing
_______________________________________________
📐 Indicatori ZigZag
· 🔍 Proiezione della Liquidità del Prezzo ZigZag
· ➖ ZigZag
· 🎯 Tracciatore di Estremità Zig-Zag
_______________________________________________
🧱 Indicatori di Supporto e Resistenza
· 🟩 Linee di Supporto e Resistenza SmartTrend
· 🧱 Tutti i Livelli di Supporto e Resistenza
_______________________________________________
📊 Indicatori di Trend e Canale
· 🔄 Canale di Trend Automatico
· 📊 Supertrend
· ⚡Analizzatore di Trend Momentum
· 💥 Sistema di Breakout del Canale
· 🌈 Gradiente Dinamico di Trend
_______________________________________________
💧 Strumenti di Volume e Liquidità
· 📉 Mappa di Liquidazione con Leva
_______________________________________________
⚡ Indicatori di Momentum e RSI
· 🔎 Tracciatore di Bias a Candela Multi-Livello
Tracker
_______________________________________________
🔮 Strumenti di Predizione e Proiezione
· 📐 Predizione Basata su Linreg& ATR
· 📏 Regressione Lineare FibonacciMulti-timeframe
· 📈 Proiettore di Flusso di Mercato Alimentato dal Volume
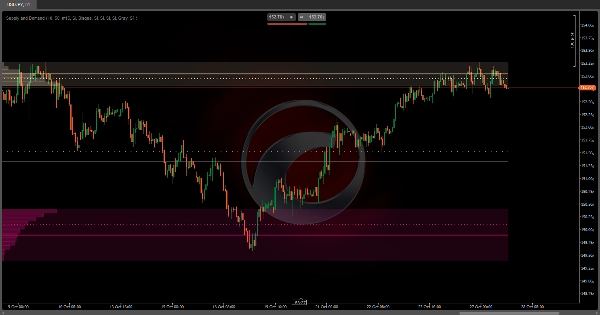
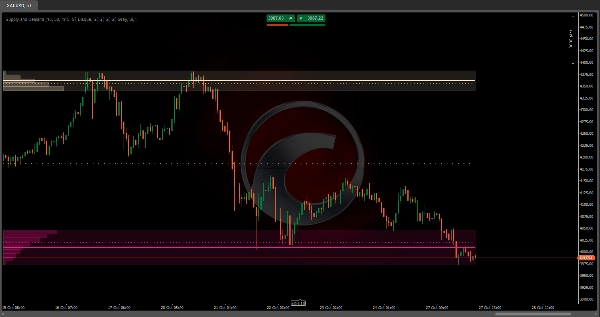
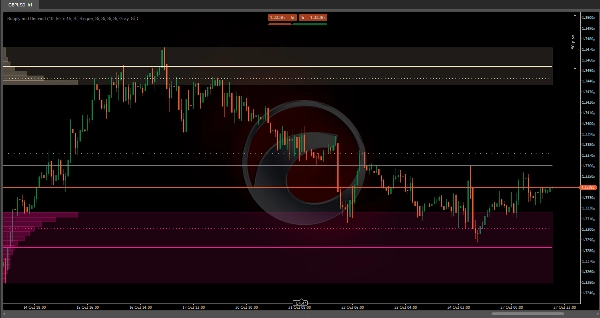
Auto Supply and Demand: 💹
Auto Supply and Demand è un indicatore avanzato di analisi del volume che identifica automaticamente le zone di maggiore attività di trading sul tuo grafico. 📊 A differenza di altri indicatori statici, questo si adatta dinamicamente all'intervallo visivo che stai osservando, ricalcolando le zone ogni volta che zoomi o scorri il grafico.
Come funziona? ❓
L'algoritmo divide l'intervallo di prezzo visibile in più livelli orizzontali (configurabili da 2 a 500 divisioni) e analizza il volume scambiato a ciascun livello. Per ottenere maggiore precisione, utilizza dati da un timeframe inferiore rispetto a quello che stai osservando. 🕒 Per esempio, se stai guardando un grafico a 1 ora, può analizzare le candele da 15 minuti per rilevare con maggior dettaglio dove il volume è stato effettivamente concentrato.
Il Processo di Identificazione 🔍
L'indicatore lavora dagli estremi verso il centro:
- Dal prezzo più alto: 🚀 Parte dal massimo dell'intervallo visibile e scende livello per livello, accumulando il volume scambiato in ogni fascia di prezzo.
- Dal prezzo più basso: 📉 Contemporaneamente, risale dal minimo, accumulando volume in direzione ascendente.
- Soglia di attivazione: ⚡ Quando una di queste zone accumula una percentuale specifica del volume totale (configurabile, 10% di default), viene marcata come zona significativa e la ricerca in quella direzione si ferma.
- Zona centrale: ⚖️ Una volta identificate entrambe le zone (superiore e inferiore), lo spazio intermedio viene marcato come zona neutra o di equilibrio.
A cosa serve? 🎯
Questo indicatore è uno strumento di analisi della struttura di mercato che ti aiuta a:
- Identificare zone di offerta: 🏔️ Aree superiori dove storicamente c'è stata alta attività di vendita.
- Identificare zone di domanda: 🏖️ Aree inferiori dove l'attività di acquisto era concentrata.
- Rilevare zone di equilibrio: 🎭 L'intervallo centrale dove la pressione di acquisto e vendita si bilanciano a vicenda.
Queste zone tendono ad agire come calamite per il prezzo in futuro, poiché rappresentano livelli dove molti partecipanti hanno preso posizione. 🧲
Come può essere combinato? 🔗
Con strategie di price action:
- Aspetta ritest delle zone identificate per cercare conferme di inversione.
- Usa le zone come obiettivi di profitto o posizionamento dello stop-loss.
Con indicatori di trend:
- In un trend rialzista, cerca ingressi quando il prezzo ritesta la zona inferiore di domanda. 📈
- In un trend ribassista, usa la zona superiore di offerta come resistenza per le vendite. 📉
Con analisi multi-timeframe:
- Identifica le zone su timeframe superiori e cerca conferme su timeframe inferiori.
- Le zone di un timeframe superiore possono contenere più zone su timeframe inferiori.
Con indicatori di momentum:
- Combina con RSI o Stocastico per confermare condizioni di ipercomprato/ipervenduto nelle zone.
- Divergenze nelle zone di offerta/domanda possono segnalare potenziali inversioni.
Configurazione Personalizzabile ⚙️
L'indicatore ti permette di regolare completamente ogni zona in modo indipendente:
- Attiva/disattiva ogni elemento visivo (aree, linee medie, linee ponderate).
- Soglia di volume: Quale percentuale del volume totale deve essere accumulata per considerare una zona significativa.
- Divisioni di prezzo: Numero più alto = maggiore precisione ma più calcoli.
- Timeframe inferiore: Definisce la granularità dell'analisi del volume.
Caratteristica Chiave: Adattamento Automatico 🔄
Ricalcolo automatico basato sulla tua visuale. Questo significa che:
- Se zoommi per vedere il dettaglio di una sessione, identificherà le specifiche zone di offerta e domanda per quelle ore.
- Se zoommi indietro per vedere settimane o mesi, ricalcolerà le macro zone per l'intero periodo.
- Ogni volta che scorri il grafico, le zone si aggiornano per riflettere il contesto dell'intervallo visibile.
Riepilogo
The indicator divides the visible price range into configurable horizontal levels (2 to 500 divisions) and analyzes volume traded at each level using data from a lower timeframe than the chart’s timeframe for enhanced accuracy. It identifies significant zones by accumulating volume from the highest and lowest visible prices until a configurable volume threshold (default 10%) is reached, marking these as supply and demand zones respectively. The area between these zones is designated as a balance zone, representing equilibrium between buying and selling pressures.
These zones highlight areas of historically high trading activity that often act as future price magnets. The indicator supports customization of visual elements, volume thresholds, price divisions, and analysis timeframe. It can be combined with price action strategies, trend indicators, multiple timeframe analysis, and momentum indicators like RSI or Stochastic to improve trade entries, exits, and confirmations.
Supported markets include Forex, Indices, Commodities, Stocks, and Cryptocurrencies, with symbols such as EURUSD, GBPUSD, BTCUSD, XAUUSD, and NAS100.
Recensioni dei clienti
5 | 50 % | |
4 | 0 % | |
3 | 0 % | |
2 | 0 % | |
1 | 50 % |