
50 percent
インジケーター
バージョン 1.0、Aug 2025
Windows、Mac
5.0
レビュー: 2

説明
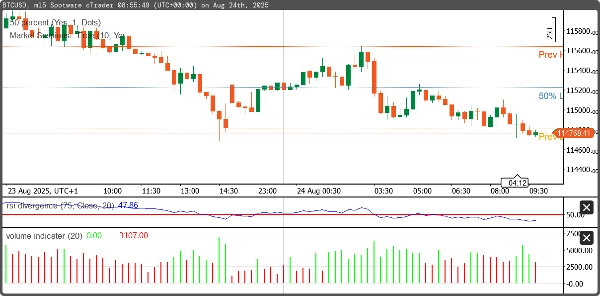
このcBotは前回のセッションの高値と安値を自動的に検出し、それらの中間点を計算します。これは、トレーダーが反転やブレイクアウト戦略でよく使用する重要なサポート/レジスタンスゾーンや市場の均衡レベルを特定するのを支援するよう設計されています。
- 前日の(またはセッションの)高値と安値を検出します。
- 高値と安値の中間点を計算します。
- チャート上に高値、安値、中間点のレベルをプロットします。
概要
インジケーターのプロフィール
カスタマーレビュー
5.0
レビュー: 2
5 | 100 % | |
4 | 0 % | |
3 | 0 % | |
2 | 0 % | |
1 | 0 % |
カスタマーレビュー
August 29, 2025
The screen feels less crowded, but the final call still needs say no.
August 20, 2025
ディスカッション
よくあるご質問
cTrader Storeで入手可能な取引ボット、インジケーター、プラグインなどの商品は、第三者の開発者が提供するものであり、情報と技術の取得のみを目的としてご利用いただけます。cTrader Storeはブローカーではなく、投資助言や個人的な推奨を行うことも、将来のパフォーマンスを保証することもありません。
この作成者の他の商品


価格
登録日 14/05/2025
10.1M
取引数量
81.44K
獲得pips
205
無料インストール