
Renko Wicks Pro
インジケーター
52 ダウンロード数
バージョン 1.0、Aug 2025
Windows、Mac
説明
🚀 精密なウィック可視化でレンコ取引を変革しましょう
標準のレンコチャートでは見えない隠れた市場データを解き放つ! 📈
✨ このインジケーターの特長は?
🎯 真のティックレベル分析 - 他のインジケーターが推測するのとは異なり、このツールは各レンコブリック内のすべてのティックを分析し、形成中に発生した実際の価格の極値を明らかにします。
🔍 他の人が見逃すものを見る - 各レンコブリック内で実際に起こった高値と安値を発見し、より良いエントリーとエグジットの判断に役立つ重要な市場洞察を提供します。
💪 他と差をつける主な機能:
🏗️ スマートローカルストレージ技術
- 計算されたすべてのウィックを自動的にローカルストレージに保存
- データを決して失わない - チャートや時間枠の切り替え、cTraderの再起動時でも
- インテリジェントな増分読み込みにより既存データの再計算を防止
- プラットフォーム再起動時のパフォーマンスへの影響を最小限に抑制
⚡ 超高速パフォーマンス
- リアルタイム進捗表示付きの日別段階的読み込み
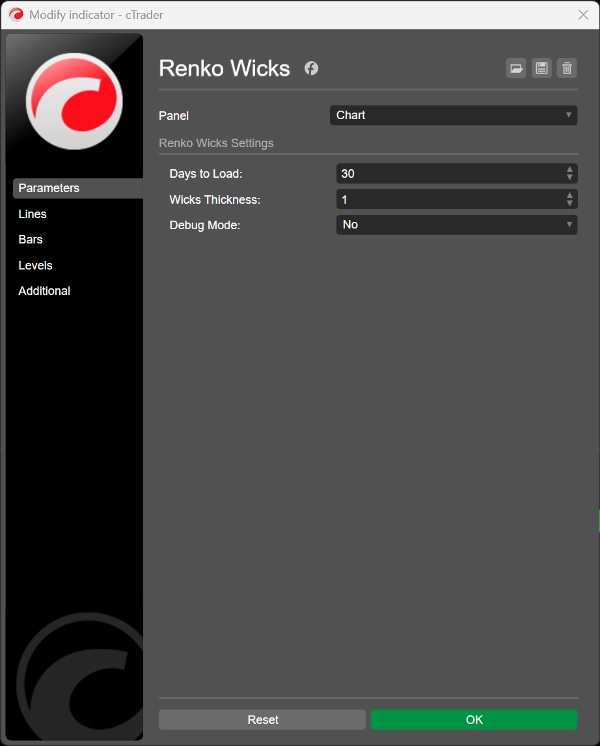
- 設定可能な履歴深度(1日以上)
- スムーズなチャート操作のための最適化されたメモリ使用
🎨 プロフェッショナルなビジュアルデザイン
- チャートの強気/弱気カラースキームに自動的にマッチ
- 完璧な視認性のための調整可能なウィックの太さ(1〜5ピクセル)
- 分析を向上させるクリーンで邪魔にならない表示
🛡️ 堅牢な信頼性
- 100%のデータ永続性 - プラットフォームの再起動、チャートの切り替え、時間枠の変更にもウィックは保持されます
- インテリジェントな重複防止でクリーンなチャートを保証
- 最大の安定性を実現する組み込みのエラーハンドリング
- 透明性とトラブルシューティングのためのデバッグモード
🎯 こんな方に最適:
📊 デイトレーダー - 正確なスキャルピング機会のための日中の極値を見つける
📈 スイングトレーダー - レンコブリック内の重要なサポート/レジスタンスレベルを特定
🔄 マルチタイムフレーム分析 - 各時間枠が独自のウィックデータベースを維持
🚨 なぜレンコウィックが重要なのか:
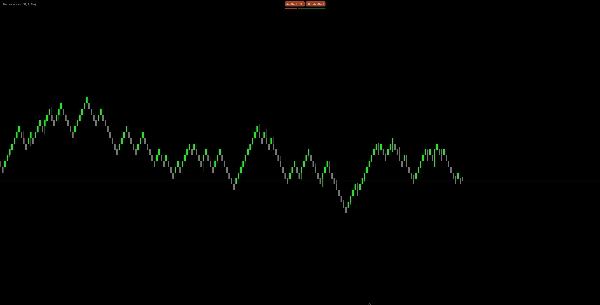
標準のレンコチャートは各ブリックの始値と終値のみを表示しますが、その間に大きな価格変動が起こっています! このインジケーターは以下を明らかにします:
- 📉 実際に価格が触れた真のサポート/レジスタンスレベル
- 🎪 各ブリック形成内の市場のボラティリティ洞察
- 🎯 実際の価格極値に基づくより良いエントリー/エグジットポイント
- 📊 情報に基づく意思決定のための強化された市場構造分析
実際のレンコトレーダーによる制作 ♥
概要
AIによる概要
Renko Wicks Pro is an indicator designed to enhance Renko chart analysis by displaying the true price wicks or tails within each Renko brick. Unlike standard Renko charts that show only open and close prices, this tool performs tick-level analysis to reveal actual intrabrick price extremes, providing deeper insights into market volatility and support/resistance levels.
Key features include smart local storage that preserves calculated wick data across chart switches, timeframes, and platform restarts, ensuring data persistence and minimizing recalculations. The indicator offers fast, progressive day-by-day data loading with configurable history depth and optimized memory usage for smooth performance. Visually, it adapts to the chart’s bull/bear color scheme and allows adjustable wick thickness for clear, non-intrusive display.
Renko Wicks Pro supports multiple timeframes, maintaining separate wick databases for each, making it suitable for day traders seeking precise scalping points and swing traders identifying key levels. It includes built-in error handling, duplicate prevention, and a debug mode for stability and troubleshooting.
By revealing hidden price movements within Renko bricks, this indicator aids in identifying true market structure, improving entry and exit decisions based on actual price extremes.
インジケーターのプロフィール
カスタマーレビュー
0.0
レビュー: 0
カスタマーレビュー
この商品にはまだレビューがありません。お使いになったことがある方は、ぜひレビューをお願いします。
ディスカッション
よくあるご質問
cTrader Storeで入手可能な取引ボット、インジケーター、プラグインなどの商品は、第三者の開発者が提供するものであり、情報と技術の取得のみを目的としてご利用いただけます。cTrader Storeはブローカーではなく、投資助言や個人的な推奨を行うことも、将来のパフォーマンスを保証することもありません。


これも好きかも


価格
239.94M
取引数量
1.84M
獲得pips
2
販売
4.83K
無料インストール