
market session
インジケーター
869 ダウンロード数
バージョン 1.0、Aug 2025
Windows、Mac
4.6
レビュー: 6
説明
📊 マーケットセッションインジケーター
市場活動分析のためのプロフェッショナルトレーディングセッションインジケーター
📝 説明
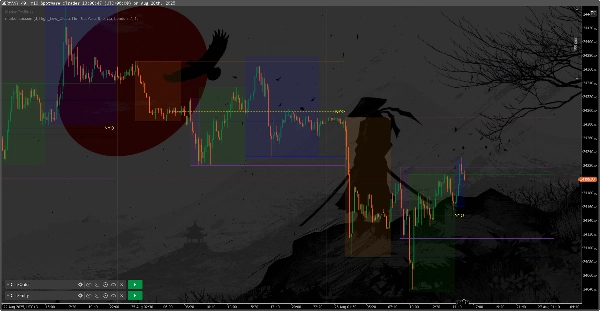
Market Sessionsは、チャート上に主要なトレーディングセッションを視覚化する強力で柔軟なインジケーターです。これは外国為替トレーダーに最適であり、暗号通貨を含む他の金融商品を取引する際にも適しています。
✨ 主な特徴
🌏 完全なトレーディングセッションのサポート
- アジアセッション 🇯🇵 (東京)
- ロンドンセッション 🇬🇧 (ロンドン)
- ニューヨークセッション 🇺🇸 (ニューヨーク)
- フランクフルトセッション 🇩🇪 (フランクフルト)
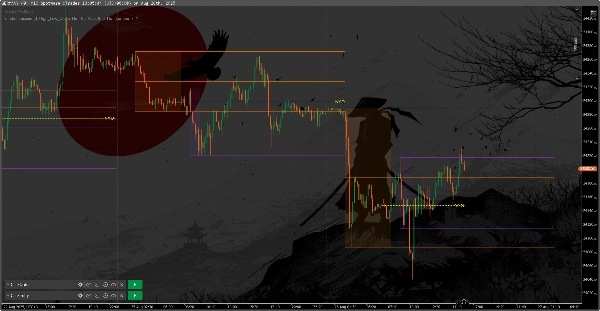
🎨 柔軟な視覚化
- 🎯 各セッションのカラフルな長方形
- 📏 拡張可能な水平の高値/安値/中間線
- 🏷️ カスタマイズ可能なセッション名
- 🔧 透明度と線の太さの調整可能
⚙️ 高度な設定
- 🕒 各セッションのカスタマイズ可能な時間
- 📅 表示日数(デフォルトは3日)
- 🔄 線の延長モード(なし/高値_安値/高値_安値_終値)
🟡 NYO(ニューヨークオープン)ライン
- ⏰ ニューヨークオープンラインの表示
- 🎨 カスタマイズ可能な線の色、スタイル、太さ
- 🔢 調整可能なNYO時間(デフォルトは04:00 UTC)
概要
AIによる概要
The Market Session indicator visually delineates major global trading sessions on financial charts, supporting the Asian (Tokyo), London, New York, and Frankfurt sessions. Designed for forex and other markets including cryptocurrencies, it displays each session as colored rectangles with customizable session names. The indicator features horizontal lines marking session high, low, and mid levels, which can be extended according to user settings. Users can adjust session times, transparency, line thickness, and the number of days displayed (default is three). Additionally, it includes a customizable New York Open (NYO) line with adjustable time, color, style, and thickness. This tool aids traders in analyzing market activity by clearly identifying key trading periods and price levels associated with each session.
インジケーターのプロフィール
カスタマーレビュー
4.6
レビュー: 6
5 | 83 % | |
4 | 0 % | |
3 | 17 % | |
2 | 0 % | |
1 | 0 % |
カスタマーレビュー
June 27, 2026
February 27, 2026
September 1, 2025
Very convenient and easy to use. Nothing extra, only the most necessary in the settings and on the chart. I recommend this indicator.
August 26, 2025
good indicator but its not clear though a little difficult to understand and the newyork open line seems tobe no where near the newyork session
ディスカッション
よくあるご質問
cTrader Storeで入手可能な取引ボット、インジケーター、プラグインなどの商品は、第三者の開発者が提供するものであり、情報と技術の取得のみを目的としてご利用いただけます。cTrader Storeはブローカーではなく、投資助言や個人的な推奨を行うことも、将来のパフォーマンスを保証することもありません。


価格
登録日 16/07/2025
869
無料インストール