
Pressure Scanner
インジケーター
バージョン 1.0、Nov 2025
Windows、Mac
4.0
レビュー: 2
説明
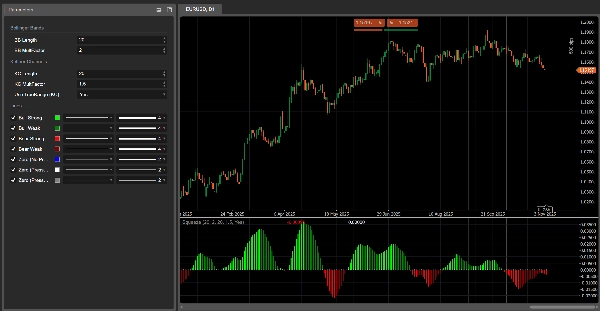
Pressure Scanner 🔍📊
1. Pressure Scannerの機能
Pressure Scanner は以下のボラティリティと方向性のツールです:
- 市場が ボラティリティ圧力/圧縮 の状態にあることを検出します ✅
- その圧力が 拡張へと解放される タイミングを示します 💥
- 結果として生じる価格の動きの 方向と強さ を スキャナ値 として測定し、ヒストグラムにプロットします。
以下を組み合わせています:
- ボリンジャースタイルの価格バンド、
- ケルトナースタイルのボラティリティチャネル、
- そして 線形回帰ベースのスキャナライン、
両方の 圧力状態(オン/解放/ニュートラル)と 方向性インパルス(上昇または下降)を表示します。
2. 動作原理(ロジック)
- ソース
インジケーターは 終値 を主な入力として使用します。 - 外側のボラティリティバンド(BBスタイル)
-
- 基準 = SMA(close,
BB Length) - 偏差 =
KC MultFactor× 終値の標準偏差 - 上バンド = 基準 + 偏差
- 下バンド = 基準 − 偏差
- 基準 = SMA(close,
- 内側のボラティリティチャネル(KCスタイル)
-
- 中心 = SMA(close,
KC Length) - レンジ = True Range または High−Low(
Use TrueRangeで設定) - レンジ平均 = SMA(range,
KC Length) - 上チャネル = 中心 + レンジ平均 ×
KC MultFactor - 下チャネル = 中心 − レンジ平均 ×
KC MultFactor
- 中心 = SMA(close,
- 圧力状態
外側のバンドと内側のチャネルを比較することで: -
- 圧力オン – ゼロに黒い点
-
- 下バンド > 下チャネル かつ 上バンド < 上チャネル
- バンドが完全にチャネルの 内側にある → ボラティリティは 圧縮され、高圧力状態。
- 圧力解放 – ゼロに灰色の点
-
- 下バンド < 下チャネル かつ 上バンド > 上チャネル
- バンドが完全にチャネルの 外側にある → ボラティリティは圧力後に 拡大しています。
- ニュートラル圧力 – ゼロに青い点
-
- その他のすべての構成。
- スキャナ値(
val)
ヒストグラムは線形回帰で計算された スキャナ値 を示します: -
- 直近の
KC Length本のバーで、インジケーターは以下を見つけます: -
- 最高値、
- 最安値、
- 終値のSMA。
- 動的なミッドラインを構築します:
-
- rangeMid = (最高値 + 最安値) / 2
- combinedMid = average(rangeMid, SMA(close))
- 次に定義します:
scannerInput=close−combinedMid\text{scannerInput} = \text{close} - \text{combinedMid}scannerInput=close−combinedMid - この
scannerInputに対してKC Length本のバーで線形回帰を実行し、最後のバーでの値が スキャナ値valとなります。
- 直近の
解釈:
val > 0→ 価格がミッドラインの 上に押し上げられている → 強気の圧力val < 0→ 価格がミッドラインの 下に押し下げられている → 弱気の圧力- バーごとの
valの変化 → その方向圧力の 増加または減少。
3. 色の読み方
ヒストグラム – 方向性圧力(スキャナ値)
ヒストグラムの各バーは val に対応し、以下のように色分けされています:
- ライム –
val > 0かつ上昇中(val > previous val)
→ 強い 強気圧力、スキャナ値が上向きに強まっています。 - グリーン –
val > 0だが下降中(val ≤ previous val)
→ 依然として強気だが、圧力が弱まっている。 - レッド –
val < 0かつさらに下降中(val < previous val)
→ 強い 弱気圧力、下降ドライブが強まっています。 - マルーン –
val < 0だが上昇中(val ≥ previous val)
→ 依然として弱気だが、圧力が弱まっている。
つまり:
- 0以上 → 強気圧力の状態
- 0未満 → 弱気圧力の状態
- 0の同じ側での色の変化 = 圧力の 加速または減速。
ゼロライン – 圧力状態
ゼロにプロットされた点は 圧力状態 を示します:
- 青 – ニュートラル圧力(通常のボラティリティ)
- 黒 – 圧力オン(圧縮がアクティブ)
- 灰色 – 圧力解放(圧縮後の拡張)
4. パラメーターリファレンス(英語)
BB Length
外側のボラティリティバンドで使用されるSMAと標準偏差の期間。
- 短いほど → より反応が速いバンド、圧力変化が頻繁。
- 長いほど → より滑らかなバンド、信号は少ないがより「マクロ」なもの。
BB MultFactor
外側バンドの偏差の乗数(柔軟性のためユーザーパラメーターとして保持)。
このポートでは、偏差の挙動は元の式と同様に KC MultFactor に結びついていますが、異なるバンドスタイルを望む場合は調整可能です。
KC Length
以下の期間:
- ボラティリティチャネルの中心線、
- レンジの平滑化、
- 高値/安値のウィンドウおよびスキャナ回帰。
Pressure Scannerがボラティリティ構造と方向性圧力を推定するためにどれだけ遡るかを定義します。
KC MultFactor
ボラティリティチャネルと外側バンドの 幅 を制御します。
- 値が大きいほど → チャネルが広くなり、圧力オン状態が少なくなります。
- 値が小さいほど → チャネルが狭くなり、圧力信号がより頻繁に発生します。
Use TrueRange (KC)
- true → チャネルレンジは True Range を使用(ギャップや急激な動きを捉えます)。
- false → レンジは単に High − Low です。
概要
インジケーターのプロフィール
カスタマーレビュー
4.0
レビュー: 2
5 | 0 % | |
4 | 100 % | |
3 | 0 % | |
2 | 0 % | |
1 | 0 % |
カスタマーレビュー
November 11, 2025
The reason it feels usable is market checks feel quicker, and signal count matters more than one nice example.
November 4, 2025
pretty decent as a backup check, especially in busy review sessions. Rushing the entry still ruins the plan.
ディスカッション
よくあるご質問
Breakout
Bollinger
cTrader Storeで入手可能な取引ボット、インジケーター、プラグインなどの商品は、第三者の開発者が提供するものであり、情報と技術の取得のみを目的としてご利用いただけます。cTrader Storeはブローカーではなく、投資助言や個人的な推奨を行うことも、将来のパフォーマンスを保証することもありません。


価格
42.11M
取引数量
6.13M
獲得pips
222
販売
8.38K
無料インストール