
説明
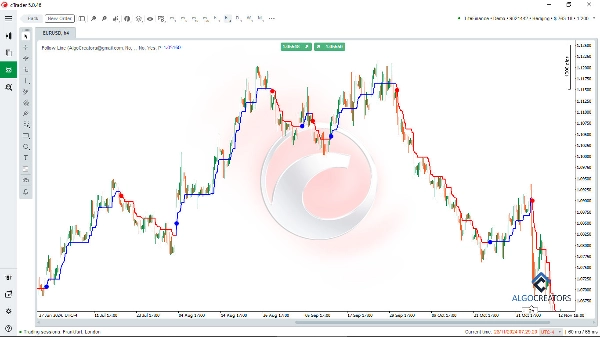
The Follow Line indicator は、トレーダーが金融市場で最適なエントリーおよびエグジットポイントを特定するのに役立つ、テクニカル分析のための強力なcTraderインジケーターです。ボリンジャーバンドとATRインジケーターを組み合わせることで、トレンドをフィルタリングし、信頼性の高い買いおよび売りのシグナルを提供します。
このインジケーターを使えば、上昇または下降の市場トレンドを簡単に見つけ、高信頼のシグナルに従うことができます。
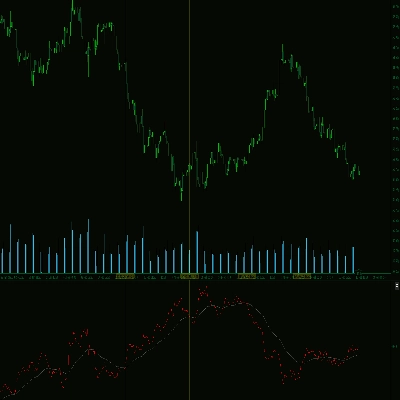
トレーダーは、Follow Line Indicatorを高度なツールであるcTrader Smart Money Assistant indicator やMACDなどのオシレーターと組み合わせて、分析を強化し取引エントリーを確認できます。
カスタマイズ可能な設定とリアルタイムアラートにより、あらゆる取引戦略に価値ある追加となり、ユーザーが自信と正確さを持って成功した取引を実行できるようにします。
主な特徴:
- トレンド検出: Follow Lineを使用して強気または弱気の市場トレンドを識別します。
- 買い/売りシグナル: ボリンジャーバンドのブレイクアウトに基づく正確な買いおよび売りシグナルを表示します。
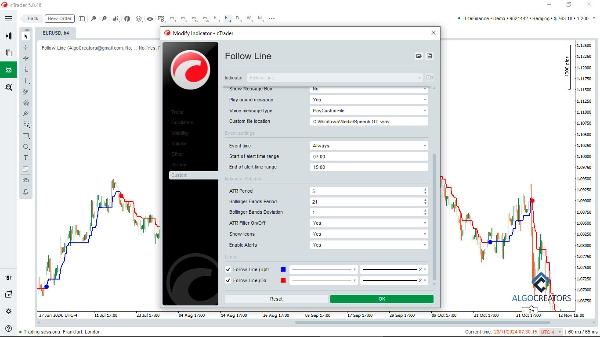
- ATRフィルター: シグナルの精度を高めるためにATRフィルターを有効または無効にするオプション。
- カスタマイズ可能な設定: ボリンジャーバンドの期間、標準偏差、およびATR期間を調整します。
- 視覚的表現: 直感的なアイコン(矢印または線)を使用してチャート上にシグナルを表示します。
- アラート: 買いまたは売りのシグナルが現れたときに即座にアラートを受け取ります。
このインジケーターは非常にカスタマイズ可能で、トレーダーは自分の戦略に合わせてボリンジャーバンドの期間、標準偏差、およびATR設定を調整できます。視覚的な手がかりと即時アラートにより、スキャルピングやスイングトレードの両方に対して使いやすく効果的です。トレンド検出、リスク管理、カスタマイズ可能な設定などの機能を備えたFollow Line Indicatorは、テクニカル分析と取引パフォーマンスを向上させたい外国為替、暗号通貨、株式トレーダーに最適です。
正確な市場機会を特定するのに最適です!
概要
AIによる概要
The Follow Line indicator is a technical analysis tool for the cTrader platform designed to identify market trends and generate accurate buy and sell signals. It combines Bollinger Bands and the Average True Range (ATR) indicator to filter trends and enhance signal reliability. Key features include trend detection for bullish and bearish markets, buy/sell signals based on Bollinger Bands breakouts, and an optional ATR filter to improve signal accuracy.
Users can customize settings such as Bollinger Bands period, standard deviation, and ATR period to align with their trading strategies. The indicator visually represents signals on the chart using intuitive icons like arrows or lines and provides real-time alerts when signals occur. It supports various trading styles, including scalping and swing trading, and is suitable for forex, cryptocurrency, and stock markets.
The Follow Line indicator can be combined with other tools like the cTrader Smart Money Assistant and MACD oscillators to confirm trade entries and enhance analysis. Its customizable features and alert system assist traders in identifying precise market opportunities and managing risk effectively.
インジケーターのプロフィール
カスタマーレビュー
4.4
レビュー: 5
5 | 60 % | |
4 | 20 % | |
3 | 20 % | |
2 | 0 % | |
1 | 0 % |
カスタマーレビュー
July 2, 2026
100% Best indicator...but in settings there should be an option to change the size of the bubble and colour of the bubbles also....
October 5, 2025
August 26, 2025
July 9, 2025
Pros: Combines Bollinger Bands and ATR for clear trend-following lines. Simple setup, stable on all assets, minimal system load. Effective for trend traders. Cons: Lacks advanced filtering (e.g., by volume), no flexible alert settings or manual level adjustment.
ディスカッション
よくあるご質問
Forex
Signal
Scalping
Crypto
ATR
MACD
Bollinger
cTrader Storeで入手可能な取引ボット、インジケーター、プラグインなどの商品は、第三者の開発者が提供するものであり、情報と技術の取得のみを目的としてご利用いただけます。cTrader Storeはブローカーではなく、投資助言や個人的な推奨を行うことも、将来のパフォーマンスを保証することもありません。
この作成者の他の商品


価格
8.31K
無料インストール